Mastering Content Marketing Metrics for Real Growth
Stop guessing and start growing. Learn which content marketing metrics actually matter and how to use them to prove ROI and refine your strategy.

Content marketing metrics are simply the numbers you track to see if your content is actually working. Think of them as the vital signs for your marketing efforts, telling you whether your articles, videos, and social media posts are healthy and hitting their targets.
Why Your Content Needs a Compass, Not Just a Map
Imagine you're setting sail across a huge ocean. A map is great—it shows you where you want to go. But it can’t tell you if you’re actually moving, which way you’re headed, or if you're sailing straight into a storm.
Creating content without tracking metrics is the same thing. You might have a goal in mind, but you have no real-time feedback to help you get there. Your content strategy is the map, but your content marketing metrics are the compass.
A compass gives you constant, reliable direction. In the same way, the right metrics guide every decision you make about your content. They help you shift your focus from vanity numbers like "more traffic" to meaningful insights that actually grow your business. This entire approach is built on a foundation of data-driven decision-making.
Metrics tell you a story. They reveal what’s working, what’s failing, and where your true growth opportunities are hiding. Without them, you’re just creating digital noise.
This data-first mindset is more important than ever. The global content marketing market is massive—valued at $413.2 billion in 2022 and on track to hit nearly $2 trillion by 2032. You can read more about these trends over at bloggingwizard.com. With that much money on the line, just making content isn't good enough anymore. You have to prove it's worth it.
By focusing on the right metrics, you can:
- Justify your budget: Show the higher-ups exactly how your content is bringing in leads and revenue.
- Optimize your strategy: Pinpoint which topics and formats your audience loves so you can make more of what works.
- Improve audience connection: Truly understand how people interact with your content, which helps you build genuine customer loyalty.
Ultimately, metrics turn your content from a creative gamble into a predictable engine for growth. They make sure every single piece you publish moves the needle and gets you closer to your destination.
The Four Pillars of Content Measurement
It's easy to get lost in a sea of data. To make sense of it all, you need a system. The best way I've found to do this is to organize your content marketing metrics around their purpose. Not all numbers tell the same story, and lumping them together is a recipe for confusion.
By grouping your metrics into four key pillars, you can turn that data chaos into a clear, actionable framework. This approach gives you a complete picture of how your content is performing, from the first time someone discovers it to the moment they become a customer.
The infographic below shows how this works in practice. Measurable goals like traffic and engagement aren't just random numbers; they're the foundation that supports your bigger business objectives.
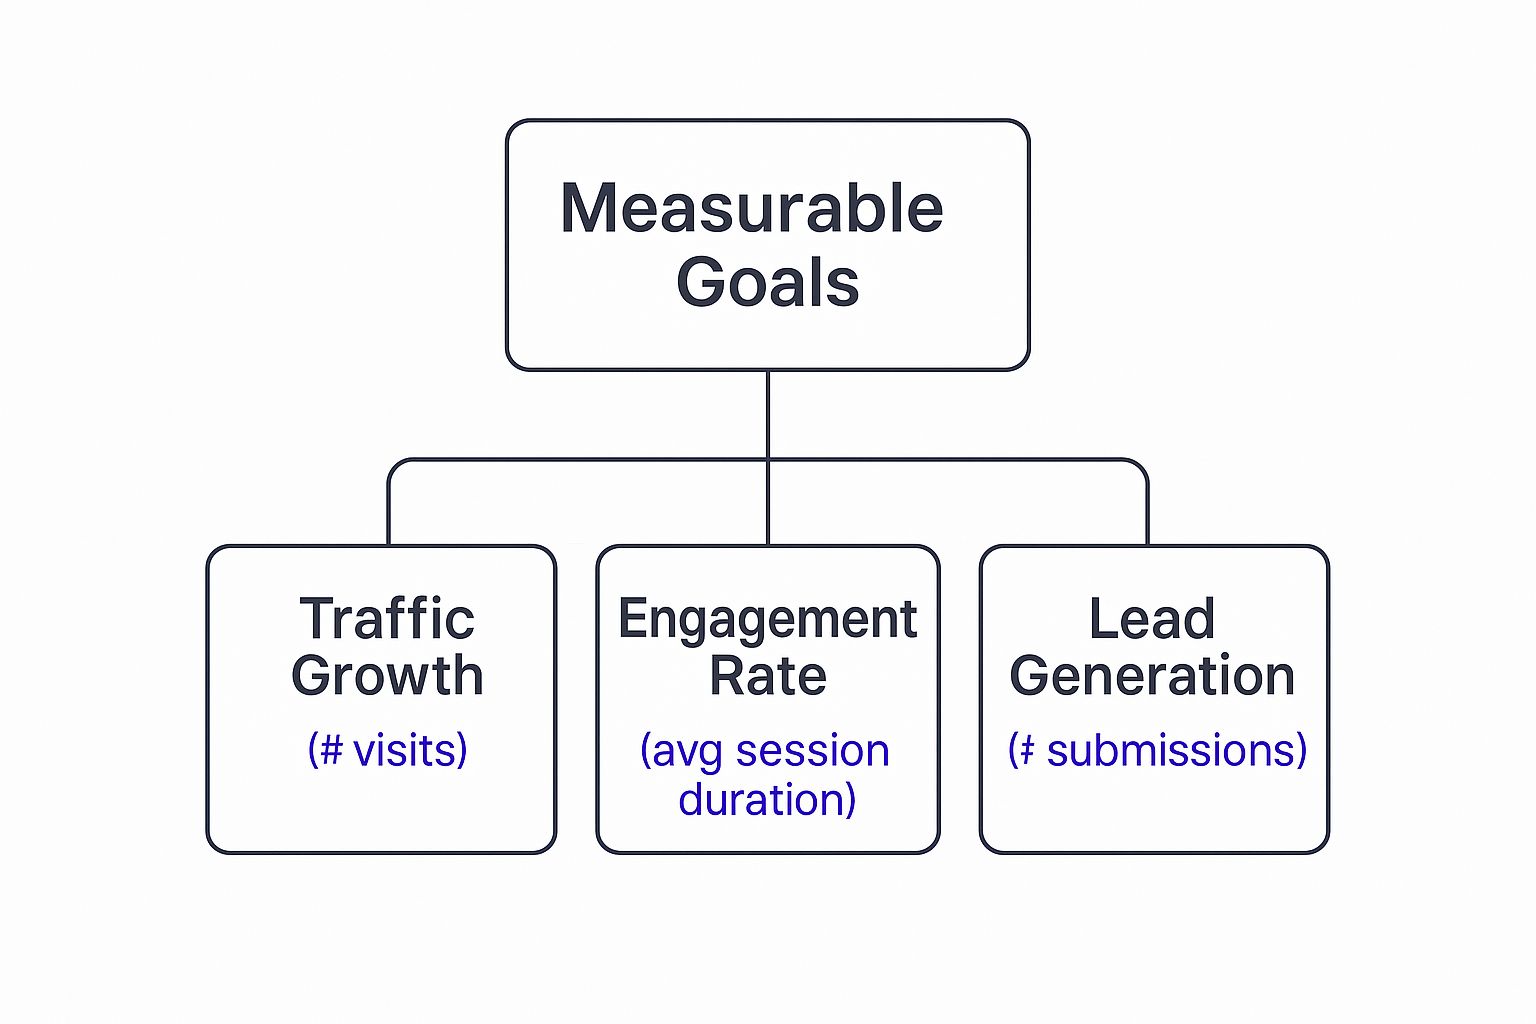
This visual shows why it's so important that every metric you track should ultimately connect back to a core business goal. That's what makes the data truly meaningful.
Let's break down this framework into what I call the "Four Pillars." This table provides a quick overview of how to categorize your metrics and understand what each one tells you about different stages of the customer journey.
| Four Pillars of Content Marketing Measurement |
| :--- | :--- | :--- |
| Metric Category | Purpose | Example Metrics |
| Consumption | Measures reach and visibility. | Page Views, Unique Visitors, Impressions |
| Engagement | Gauges audience interaction and interest. | Time on Page, Bounce Rate, Social Shares, Comments |
| Lead Generation | Tracks how content drives potential customers. | Form Submissions, Conversion Rate, Email Subscribers |
| Revenue | Connects content directly to business income. | Customer Acquisition Cost (CAC), Customer Lifetime Value (CLV) |
By using these four pillars, you can get a holistic view of your content's performance instead of getting stuck on a single, isolated number. Now, let’s dive into each one.
Pillar 1: Consumption Metrics
Let’s start with the basics. Consumption metrics answer one simple question: "Are people even seeing my content?" These numbers are your first signal that your content is actually reaching an audience and getting some visibility.
Think of these as the digital equivalent of foot traffic past your storefront. High numbers here are a great sign that your promotion and distribution efforts are working.
- Page Views: The total number of times a specific page was loaded by visitors.
- Unique Visitors: The number of individual people who have stopped by your site.
- Impressions: How many times your content appeared in someone's feed, a common metric for social media.
Pillar 2: Engagement Metrics
Once you know people are seeing your content, the next logical question is: "Are they interacting with it?" Engagement metrics tell you how interesting and valuable your audience finds what you've created.
If consumption is foot traffic, engagement means people are stopping to look in your window. Low engagement is a huge red flag that your content just isn't connecting with your audience.
Engagement is the currency of modern marketing. It shows that your content doesn't just exist—it resonates. It's the difference between a monologue and a conversation with your audience.
Key engagement metrics include Time on Page, which tells you how long people are actually sticking around to read, and Bounce Rate, the percentage of people who leave after viewing just one page. You also have social signals like likes, comments, and shares, which show that your audience is actively participating. For a deeper dive, check out our guide on essential metrics and reporting.
Pillar 3: Lead Generation Metrics
Okay, now we're getting to the good stuff. This is where your content starts to have a direct impact on your business goals. Lead generation metrics answer the all-important question: "Is my content inspiring people to take action?"
These numbers show you how well your content moves people from being casual readers to becoming potential customers. A high conversion rate here means your content isn't just informative—it's persuasive.
- Form Submissions: The number of people who filled out a contact form or downloaded a guide.
- Email Subscribers: How many new subscribers your content is bringing in.
- Conversion Rate: The percentage of visitors who take a specific, desired action.
Pillar 4: Revenue Metrics
This is the final and, for many, the most important pillar. Revenue metrics give you the ultimate proof that your content marketing is working by answering: "Is our content actually making money?"
This is where you connect your efforts directly to the bottom line. It's how you show stakeholders that content isn't just an expense; it's an investment with a real return. Key metrics here are things like Customer Acquisition Cost (CAC) and Customer Lifetime Value (CLV). Tracking these proves that your content is a powerful engine for genuine business growth.
Connecting Content Metrics to Business ROI
Let's be honest: a spike in website traffic is a great ego boost, but it doesn't keep the lights on. The real magic of content marketing metrics happens when you can connect the dots between a blog post and your company's bank account. This is where you graduate from simply tracking activity to proving real, measurable value.
Stakeholders and the C-suite speak one language fluently: return on investment (ROI). They want to see that the time and money you pour into creating content are actually bringing in more revenue than they cost. To make a rock-solid case for your content strategy, you have to look past the vanity metrics.

From Page Views to Profit
The first move is to start focusing on metrics that tell a story of business growth. These are the numbers that prove your content isn't just a marketing expense—it's a revenue-generating machine.
- Lead Quality: It’s not about how many leads your content brings in, but how good they are. Are these people actually a good fit for your product? Tracking how many leads from your content make it past the initial qualification stage is what really counts.
- Sales Conversion Rate: Out of all the leads that came from a specific article or video, what percentage actually pulled out their credit card and became a customer? This is the metric that ties your content directly to sales.
- Customer Acquisition Cost (CAC): How much are you spending to get a new customer through your content marketing efforts? A successful content strategy should steadily lower your CAC over time, especially when you compare it to channels like paid advertising.
Focusing on these KPIs shifts the entire conversation. You'll go from answering "How many people read our blog?" to confidently stating, "Our blog generated X amount of revenue last quarter." It’s a game-changer.
Calculating Your Content Return on Investment
Figuring out your ROI is the ultimate way to prove your content’s worth. The formula might look a little intimidating at first, but the idea behind it is incredibly simple: are you making more money from your content than you’re spending on it?
Return on Investment (ROI) = [(Revenue from Content - Cost of Content) / Cost of Content] x 100
This calculation gives you a straightforward percentage that spells out the financial performance of your work. And when content marketing is done well, the returns can be staggering. Some reports show an average return of $42 for every $1 spent—a number that makes everyone sit up and pay attention.
For a deeper look into the mechanics, it’s worth understanding how to calculate ROI in more detail.
The Long-Term Value of Content
Finally, don't get so caught up in the immediate sale that you miss the bigger picture. This is where Customer Lifetime Value (CLV) comes in. This metric calculates the total revenue you can expect from a single customer you acquired through your content over the entire course of their relationship with you.
When you see a high CLV for customers whose first touchpoint was your blog or an e-book, you have proof that your content attracts and keeps the right kind of clients. It shows you’re not just making one-off sales; you’re building a foundation for sustainable growth. To make sure you're setting yourself up for this kind of success, it always helps to brush up on content marketing best practices.
How to Build Your Content Performance Dashboard
Knowing which content marketing metrics to track is one thing, but making sense of them all is where the magic happens. That's the job of a content performance dashboard. It's your command center, the one place where all that scattered data comes together to tell a clear, actionable story.
Think of it like a pilot's cockpit. A pilot doesn’t check dozens of separate gauges; they have a central display showing the most critical flight information at a glance. Your dashboard does the same for your content, pulling data from all over the web into one unified view. Without it, you’re just collecting numbers. With it, you're building a real strategy.
This central hub helps you stop reacting to every little data point and start seeing the bigger picture. You can spot trends as they emerge, pinpoint which articles or videos are actually driving results, and share those wins with your team in a way everyone can understand.
Choosing Your Dashboard Tools
You don't need a crazy-expensive or complicated setup to get this done. The whole point is to create a single source of truth, and there are plenty of powerful tools that can help.
- Google Analytics (GA4): This is non-negotiable. It's the bedrock of any content dashboard, giving you the essential website data like organic traffic, time on page, and conversion rates. It’s free and incredibly powerful.
- Social Media Analytics: A tool like Repostly is a lifesaver here. It pulls in the analytics from all your social channels so you can track engagement, reach, and follower growth without having to log into five different apps.
- Data Visualization Tools: This is where you bring it all together. Platforms like Google Looker Studio (what used to be Data Studio) or Tableau let you pull in data from GA4, your social tools, and more to create custom, interactive dashboards that look great and are easy to read.
What to Include in Your Dashboard
A great dashboard is all about clarity, not cramming every possible metric onto one screen. Start by building reports that answer your most important questions. The goal is to show the data in a way that makes trends jump out at you.
For instance, a standard report in Google Analytics gives you a quick, high-level look at your website's traffic and user engagement.

This kind of snapshot immediately tells you how things are going, letting you assess the overall health of your content marketing at a glance.
To start, focus on creating simple charts and tables for these key areas:
- Traffic Source Overview: A simple pie chart showing where your visitors are coming from (Organic, Social, Direct, Referral). This immediately tells you which channels are your heavy hitters.
- Top Performing Content: A clean table listing your top 10 blog posts by page views, average engagement time, and conversions. This is how you find your "unicorn" content that you can learn from and replicate.
- Lead Generation Tracker: A line graph that tracks your form submissions or newsletter sign-ups over time. This visualizes the direct connection between your content and your lead gen goals.
Your dashboard shouldn't just be a place to dump data; it should be a tool that helps you make decisions. If a metric doesn't help you make a smarter choice, it doesn't belong on your main dashboard.
By choosing the right visuals, you transform that dashboard from a boring report into a powerful command center. It makes your content marketing metrics easy to understand and use, turning raw data into a clear roadmap for growth.
Turning Data Into Smarter Content Decisions
Collecting data is just the first step. The real magic happens when you use those content marketing metrics to make smarter, more strategic decisions. This is where you graduate from asking what happened to digging into why it happened—and, most importantly, what you should do about it.
Think of it as a feedback loop. Every metric you track should fuel a cycle of continuous improvement for your content.
This whole process kicks off when you identify your high-flyers—what some of us in the industry call "content unicorns." These are the articles, videos, or posts that just blow everything else out of the water. Your dashboard will make these outliers obvious. Once you spot them, your job is to put on your detective hat and figure out what makes them so special.
Diagnose Your Content Performance
To turn those insights into real action, you have to look at both your wins and your losses. Lay your best and worst-performing content side-by-side and start hunting for patterns. What separates the home runs from the strikeouts?
Start by asking some pointed questions:
- Why did this post get so many shares? Was it the punchy headline? The format, like a listicle or a deep-dive case study? Or was the topic itself just perfectly timed?
- Why does that article have such a high bounce rate? Is the intro a total snooze-fest? Does the page take forever to load? Maybe there’s a major disconnect between what the title promised and what the content delivered.
- Which content drives the most qualified leads? This one is huge. After all, 73% of B2B marketers consider content like blogs and white papers their top tool for generating sales. Pinpointing the exact pieces that convert helps you double down on what truly works.
Answering these questions gives you a clear roadmap. Once you have a handle on the numbers, you can start refining your approach. For example, you can explore proven strategies to improve Click Through Rates (CTR) for headlines that just aren't pulling their weight.
Create an Optimization Plan
With your diagnosis complete, it's time to get your hands dirty. Don't just guess what might work—adopt a testing mindset. Based on your analysis, form a hypothesis and test it out methodically.
For instance, if you realize your top articles all feature quotes from industry experts, your plan could be to add quotes to three of your mid-tier posts and watch their engagement for the next month. Or if low time-on-page is plaguing a key article, try embedding a video or a sharp infographic to see if it keeps people scrolling. You can monitor these tweaks closely by using powerful social media analytics tools.
The goal is to move from putting out fires to building a proactive system of optimization. Every data point, good or bad, is a lesson that makes your next piece of content just a little bit better than the last.
This structured approach turns your metrics from a passive report card into an active, living guide. You’ll learn how to replicate your successes, shore up your weaknesses, and build a content engine that actually delivers results. This is how you stop throwing content at the wall to see what sticks and start creating stuff that consistently hits the mark.
Common Mistakes to Avoid When Tracking Metrics
It’s one thing to track your metrics, but it's another thing to track the right ones and avoid the common traps that trip up even seasoned marketers. Getting this wrong can send you down a rabbit hole, leading to bad decisions and wasted effort. Let's make sure your content marketing metrics are actually telling you the real story.

One of the biggest blunders is chasing vanity metrics. These are the flashy numbers—like social media likes or total page views—that look impressive on a report but don't actually move the needle for your business. Sure, a post with 1,000 likes feels great, but if it didn't bring in a single lead or sale, how successful was it really?
Then there's the problem of incorrect attribution. This is a sneaky one. It happens when you can't accurately trace a conversion back to the content that truly sparked a customer's interest. You might end up giving all the credit to the final ad they clicked, completely overlooking the brilliant blog post that first put your brand on their radar weeks ago. This mistake keeps your best-performing content hidden in the shadows.
Focusing Only on Quantitative Data
Numbers are essential, but they don't tell the whole story. A massive mistake is getting so lost in the data that you forget to listen to the people behind the clicks.
Quantitative data tells you what happened. Qualitative data tells you why it happened. You need both to build a strategy that truly resonates with your audience.
If you ignore comments, survey results, and direct feedback from customers, you're missing out on the "why." A high bounce rate is just a statistic until a user comment reveals that your page is confusing or the content simply missed the mark.
Here are a few more classic mistakes to sidestep:
- Tracking Too Many Metrics: It’s tempting to build a dashboard with every metric under the sun, but this usually just leads to analysis paralysis. Instead, focus on a handful of key performance indicators (KPIs) that are directly tied to your most important business goals.
- Forgetting Context: A 5% conversion rate means absolutely nothing on its own. Is that high or low for your industry? Is it better than last month? Always look at your data in comparison to benchmarks and your own past performance.
- Ignoring Content Decay: Great content doesn't stay great forever. If you're not keeping an eye on older posts, you'll miss the slow decline in traffic and engagement. This is a huge missed opportunity for a quick content refresh that could bring it right back to the top.
Got Questions About Content Metrics? We've Got Answers.
Diving into content marketing metrics can feel like learning a new language. It's totally normal to have questions. Here are some of the most common ones we hear, broken down into plain English.
What’s the Single Most Important Content Marketing Metric?
This is the classic question, but there's a trick to it: there is no single "most important" metric. The best metric always ties back to what you're trying to achieve with your content. Think of it like a toolbox—you wouldn't say a hammer is more important than a screwdriver, right? It just depends on the job.
- If your goal is brand awareness, you’ll want to watch metrics like organic traffic and social media reach like a hawk. These tell you how many people are seeing your stuff.
- If you’re all about lead generation, then your world revolves around your conversion rate and cost per lead.
- And if you need to show the higher-ups that your work impacts the bottom line, nothing tells that story better than ROI and customer lifetime value (CLV).
How Often Should I Be Checking My Metrics?
It's tempting to hit refresh on your analytics all day, but that can lead to making knee-jerk decisions based on normal daily fluctuations. It's much better to get into a consistent rhythm.
A good rule of thumb is to do a quick weekly check-in to spot major trends in traffic and engagement. Then, schedule a deeper monthly analysis to see how you're tracking against your goals. Finally, a comprehensive quarterly review will give you the perspective you need to make bigger strategic changes.
How Can I Track ROI on Content That Doesn't Directly Sell Anything?
This is a tough one, especially for top-of-funnel content like blog posts or infographics. The magic word here is "assisted conversions."
You can use a tool like Google Analytics to see how many times a piece of content played a role in a customer's journey before they finally made a purchase or signed up. It might not have been the final click, but it helped them along the way. Another great tactic is to assign a dollar value to actions like a newsletter signup or a free download to start quantifying their impact.
Ready to stop guessing and start growing? Repostly pulls all your key metrics into one clean dashboard, so you can track performance across every social platform without the headache. It turns messy data into clear, actionable insights. Start your free 7-day trial of Repostly and see what your metrics are really telling you.
Keep reading

10 Fresh Instagram Story Idea Tactics for 2025
Stuck for content? Discover our top Instagram story idea list, with actionable tips to boost engagement and grow your audience in 2025.

A Practical Social Media Planner for German Markets
Build a results-driven social media planner for Germany. This guide offers actionable strategies for content, scheduling, and analysis in the German market.

Crafting Your Social Media Content Plan
Stop guessing and start strategizing. This guide provides an actionable social media content plan to audit, plan, and execute content that gets results.
Post once. Show up everywhere.
Start your 7-day free trial and publish your next video to every platform in minutes.Pick a plan and publish your next video to every platform in minutes.
Start your free trialSee plansCancel anytime