Unlock Growth with Data Analytics in Social Media Today
Discover how data analytics in social media can boost your brand's growth, engagement, and insights. Learn more about leveraging social data effectively.
So, what exactly is social media data analytics? Think of it as the process of gathering all the bits and pieces of data from your social channels, making sense of them, and then using what you learn to make smarter business decisions. It’s about looking past the obvious stuff, like how many likes or followers you have, to really understand why certain things resonate with your audience and how your social media hustle actually affects your business's health.
Going Beyond Likes: The Real Power of Social Data
Picture this: you're a detective, and your brand is the case you're trying to crack. Social media platforms are your scene, and they're covered in clues. Every single like, comment, share, and DM is a piece of the puzzle. Data analytics in social media is the magnifying glass that helps you put it all together and figure out what your audience truly wants.
This isn't about getting bogged down in complicated charts or drowning in technical terms. It's simply about listening to the story your data is telling you. You get to see exactly what posts stop people in their tracks, what topics get them talking, and what they honestly think about what you’re selling.
Uncovering the Story in the Numbers
The first big step is to move beyond "vanity metrics." Sure, a huge follower count looks impressive on paper, but it doesn’t mean much on its own. The real magic happens when you understand the context behind those numbers.
For instance, imagine a post gets just a handful of likes but tons of shares and saves. What does that tell you? It means your audience found it so incredibly useful that they wanted to save it for later or pass it along. That’s a way more powerful signal than a post that gets a bunch of quick likes but no real engagement.
When you start analyzing the patterns in your social media data, you stop guessing what might work and start knowing what does. It’s like the difference between finding your way with a map and compass versus just winging it—one is a whole lot more precise.
From Raw Data to Real-World Decisions
At the end of the day, social analytics is all about taking action. The insights you uncover should feed directly back into your strategy and lead to real results for your business. It’s about turning numbers on a screen into actual improvements that help you build a genuine connection with your audience.
Here’s what that looks like in practice:
- A Better Customer Experience: By keeping an eye on comments and messages, you can spot common frustrations or questions and get ahead of them. A clothing brand might see tons of questions about sizing on their Instagram and decide to create a super-helpful sizing guide video to clear things up.
- Smarter Product Ideas: Listening to conversations online can tip you off to what your audience is craving. A local coffee shop could see everyone chatting about pumpkin spice in late August and use that insight to launch their fall menu a week early.
- More Efficient Operations: Analytics shows you where to put your time and money. Once you know which types of content and which posting times get the best results, you can stop wasting energy on what isn't working and double down on what is.
- A Leg Up on the Competition: You can even analyze what your competitors are doing to find weak spots in their strategy or see an opportunity they’re missing. It’s not about copying them—it’s about understanding the playing field so you can find your own unique advantage.
Ultimately, using data analytics gives you a direct line to your audience. It helps you build a brand that people don't just see, but one they actually connect with, which is how you build loyalty and grow for the long haul.
Understanding The Metrics That Actually Matter

Jumping into social media analytics can feel like trying to drink from a firehose. With dozens of numbers flashing across your dashboard, it’s easy to get lost. The secret isn't tracking everything; it's tracking the right things.
To really make sense of it all, we can group the most important metrics into three core categories: Engagement, Reach, and Conversion. Each one tells a different but equally crucial part of your brand's story. Think of them as instruments in an orchestra—on their own, they’re just noise, but together, they create a clear picture of your success.
Gauging Audience Connection Through Engagement
Engagement is the most obvious sign of a healthy social media presence. It’s all about the active, voluntary actions people take on your content. It’s the digital equivalent of a nod, a question, or applause from your audience, proving they aren't just scrolling past.
Common engagement metrics include:
- Likes: The simplest form of feedback, indicating immediate approval.
- Comments: A sign of deeper interest, showing your content sparked a thought or question.
- Shares: This shows your content was so valuable that users wanted to broadcast it to their own networks.
- Saves: A powerful indicator that your content is seen as a resource to be revisited later.
A spike in shares, for instance, tells you you've hit a nerve and created truly valuable content. To really get a handle on this, it's essential to master techniques for measuring social media engagement effectively. We also have a comprehensive guide that goes deeper on how to measure social media engagement.
Evaluating Your Content's Visibility With Reach
While engagement shows who is interacting, reach tells you how many people are seeing your content in the first place. This is all about the size of your potential audience and how well you’re getting your message in front of new eyes.
Key reach metrics are:
- Impressions: The total number of times your content was displayed on a screen.
- Reach: The number of unique people who saw your content.
- Audience Growth Rate: How quickly you are gaining new followers.
This matters because you can’t engage an audience that never sees your posts. Growing your reach is fundamental to expanding your brand’s influence. With approximately 5.24 billion active social media users globally—a number that has more than doubled since 2015—there's a massive pool of potential connections out there.
Measuring Business Impact With Conversion
This is where the rubber meets the road. Conversion metrics track whether your audience is taking the specific, valuable actions you want them to take after seeing your content. This is how you directly measure your return on investment (ROI).
Conversion metrics might include:
- Click-Through Rate (CTR): The percentage of people who click a link in your post.
- Leads Generated: The number of potential customers who filled out a form or signed up for your newsletter.
- Sales: Direct purchases that can be traced back to a social media campaign.
A high CTR on a product post, for example, is a dead giveaway that you have a compelling offer and an effective call-to-action.
By tracking these three distinct categories, you move beyond simply counting likes. You start to understand the complete user journey—from initial awareness (Reach), to active interest (Engagement), to tangible business results (Conversion).
The table below breaks down how these metrics align with specific business objectives, helping you connect your social media activity to what really matters for your bottom line.
Key Social Media Metrics and Their Business Impact
This table breaks down the essential social media metrics, explaining what each one measures and why it is so important for your business strategy.
| Metric Category | Specific Metric | What It Measures | Why It Matters |
|---|---|---|---|
| Engagement | Comments & Shares | Audience interaction and the perceived value of your content. | Indicates a strong brand community and content that truly resonates with your followers. |
| Reach | Audience Growth | The rate at which you are acquiring new followers. | Shows your brand awareness is expanding and your content appeals to new users. |
| Conversion | Click-Through Rate (CTR) | The percentage of viewers who clicked on a link in your post. | Measures how effectively your content drives traffic to your website or landing pages. |
Ultimately, looking at these metrics together gives you a holistic view of your performance, helping you make smarter decisions that drive real growth.
Your Four-Step Social Analytics Game Plan
Trying to turn a mountain of raw social media data into a winning strategy can feel like drinking from a firehose. Without a clear process, it's easy to get lost in a sea of numbers and never find the story they're trying to tell. The trick is to have a simple, repeatable framework that helps you make confident decisions.
Think of it like building with LEGOs. You wouldn't just dump all the bricks on the floor and hope a castle appears. You’d follow a plan: sort the pieces, build the foundation, add the walls, and finally, place the towers. A solid social analytics plan works the same way, giving you a logical path to build real results.
This four-step process takes the guesswork out of data analytics in social media and makes it a routine part of your workflow.
Step 1: Set Clear Goals
Before you even glance at a single metric, you need to know what you’re trying to accomplish. Your goals are your compass. They make sure every bit of analysis you do is actually pushing you forward. Otherwise, you’re just collecting data for data's sake.
Your goals need to be specific and tied to real business outcomes. Are you trying to get your brand name out there, pull in more leads, or drive sales from your online store? Each of those objectives requires looking at completely different sets of numbers.
For example:
- An e-commerce store might have a goal to "Increase website conversions from Instagram by 15% in Q3." All their analysis will be laser-focused on click-through rates and conversion data.
- A B2B service provider might aim to "Generate 50 qualified leads from LinkedIn this month." They'll be digging into engagement within industry groups and lead form submissions.
Step 2: Gather the Right Data
Once you know what you're aiming for, it's time to collect the clues. This isn't about grabbing every single data point you can find. It’s about being selective and gathering only the information that matters for your goals. Overloading yourself with irrelevant numbers is a fast track to confusion.
This is where the right tools come in. The analytics built into the platforms themselves (like Meta Business Suite) are a decent place to start. But for a bird's-eye view, dedicated tools like Repostly are a game-changer. They pull data from all your channels into one dashboard, which saves a ton of time and helps you spot trends across different platforms.
This image shows some of the common ways analytics tools get the data they need, from connecting directly to platforms to monitoring the wider web.
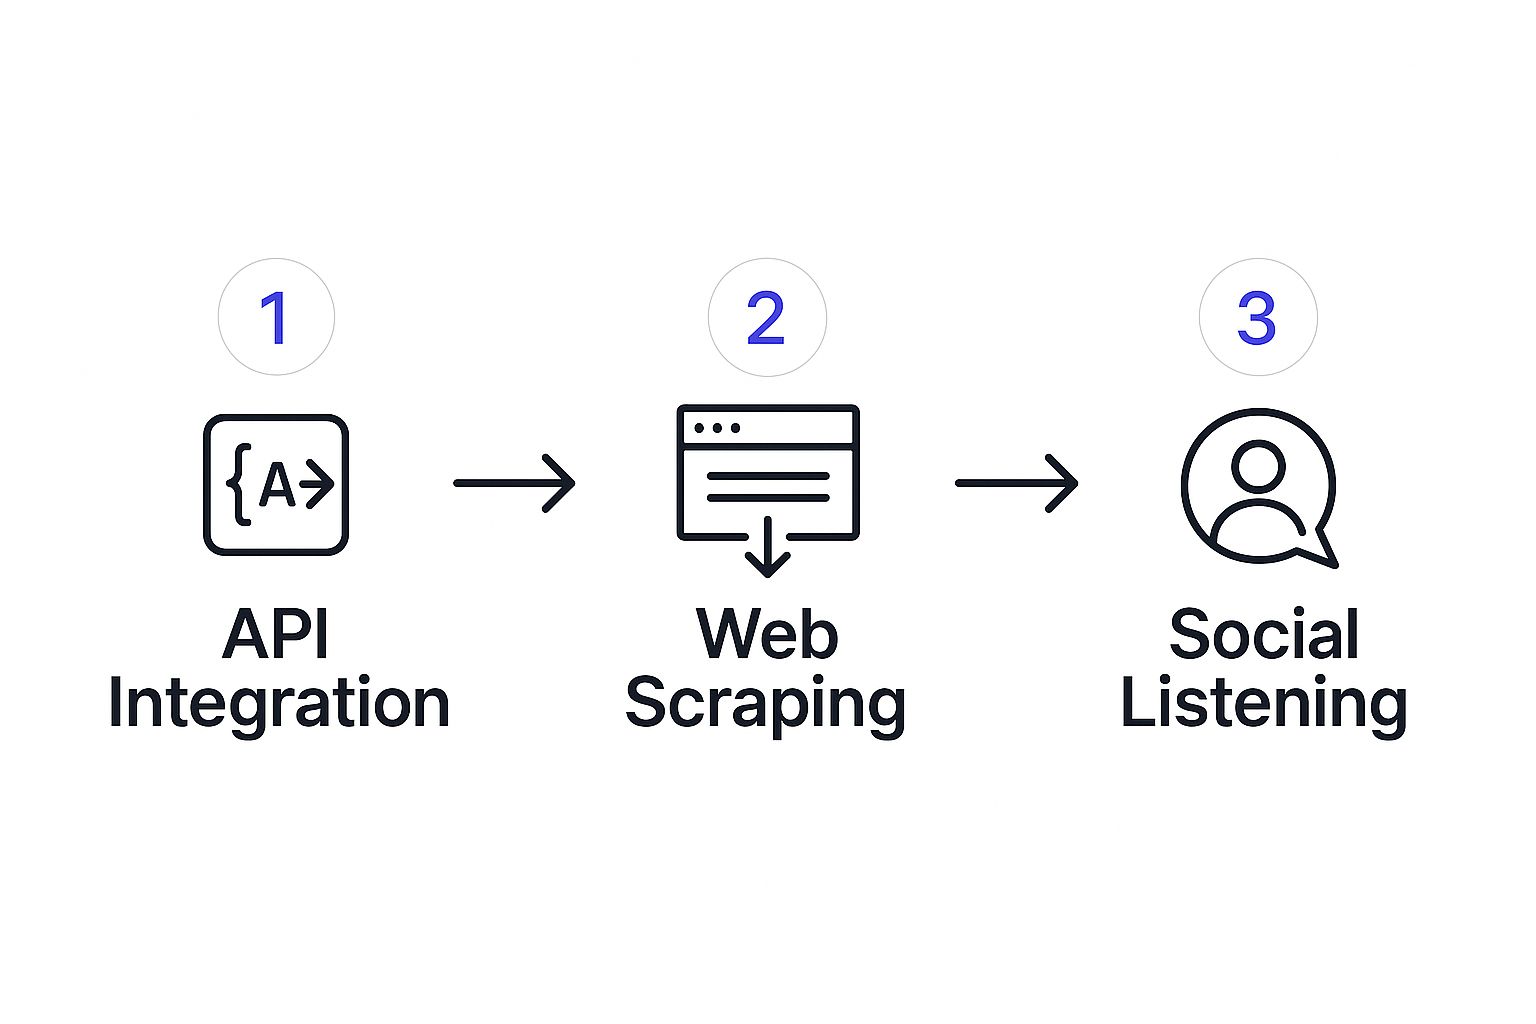
As you can see, these platforms pull information through API connections, web scraping, and social listening to build a complete picture of your performance and what people are saying about you.
Step 3: Analyze and Find Insights
Now you get to be the detective. This is where you connect the dots and uncover the story hidden inside the numbers. Analysis is so much more than just reporting stats; it’s about constantly asking, "Why?" Why did that one post blow up while the other one flopped? Why did our engagement suddenly dip last week?
An insight is that "aha!" moment when you finally understand the reason behind the data. It’s the difference between saying, "Our reach went up by 20%," and saying, "Our reach went up by 20% because our new video series really clicked with a younger audience, which we can now target more effectively."
Keep an eye out for patterns, weird spikes or dips, and things that seem connected. For instance, you might notice that posts featuring customer stories consistently get way more engagement and clicks. That's a powerful insight you can immediately use to plan future content.
Step 4: Report and Act
This last step is the most important one. You have to turn your insights into action. A brilliant analysis is completely useless if it just collects dust in a report. The whole point is to create a feedback loop: data tells you what to do, you make changes, and then you measure what happens next.
Create simple, clear reports that get straight to the point—here are the key findings and here's what we should do about them. Share these with your team so everyone's on the same page. Then, actually do it. If your analysis showed your audience is most active on weekday mornings, change your posting schedule. If you found that "how-to" guides bring in the most website traffic, make more of them.
This four-step cycle—Goal, Gather, Analyze, Act—is your repeatable game plan for success. Stick with it, and you'll turn social media from a channel of guesswork into a predictable engine for growing your business.
Picking Your Social Media Analytics Toolkit
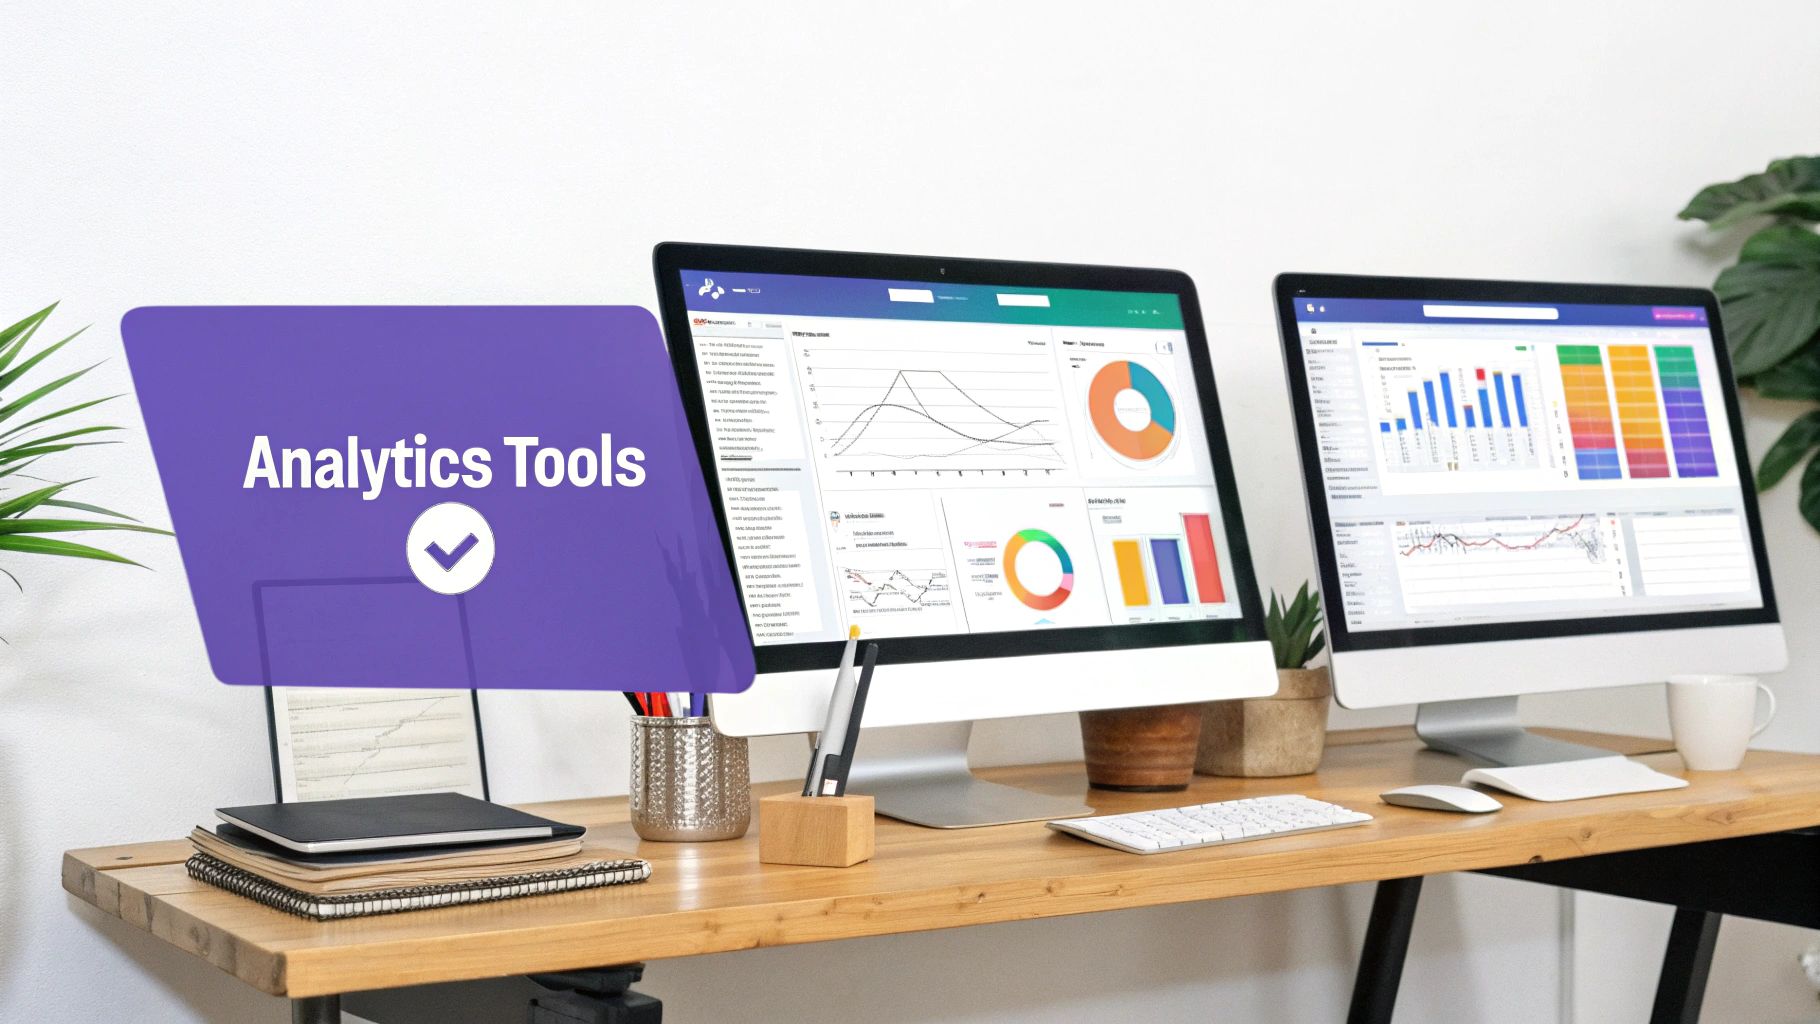
A dashboard like this from Repostly pulls everything together, giving you one clear view of how all your accounts are performing. When all your data is in one place, you can finally stop hopping between platforms and start seeing the trends that actually matter.
Choosing the right tools for data analytics in social media can feel overwhelming, but it really comes down to what you need. Think of it as a balance between cost, convenience, and how deep you need to go with your insights.
The great news? You don't need a huge budget to get real value. The trick is to find a tool that fits what you're trying to do right now but also has room to grow with you.
Let’s look at the main options you have.
Native Platform Analytics
Every big social network—Meta, X, TikTok, you name it—gives you its own free analytics dashboard. For anyone just dipping their toes into social media data, these are the perfect place to start. They’re built right in and don't cost a dime.
- Best For: Beginners, solo creators, or small businesses on a tight budget who just need to see basic stats for one platform at a time.
- Key Limitations: Their biggest weakness is that they don't talk to each other. You have to log into each account separately, which makes spotting cross-channel trends a real headache.
Think of native tools like the basic toolkit that comes in the trunk of a new car. They’re fine for simple, everyday tasks, but you wouldn't use them to rebuild the engine.
All-in-One Third-Party Suites
This is where tools like Repostly really come into their own. They’re built to fix the biggest headache of native analytics: they pull all your data from every platform into one clean, simple dashboard.
This unified approach is a massive time-saver, but more importantly, it unlocks much deeper insights. You stop asking, "How did my Instagram post do?" and start asking, "How is my entire social strategy working?" That's how you make smarter, big-picture decisions.
An all-in-one suite takes your scattered data points and weaves them into a single, clear story about your brand's performance. It’s the difference between staring at a pile of puzzle pieces and seeing the finished picture.
These platforms often pack in other useful features, too, like post scheduling and automated reports. And as you weigh your options, it's worth exploring helpful comparisons, like these top Linktree alternatives for social media, to find what works best for your setup.
Specialized Social Listening Tools
While analytics suites are focused on your channels, social listening tools are like a radar for the entire internet. They scan social media, blogs, and forums for mentions of your brand, your competitors, or key industry terms.
- Best For: Bigger brands that are serious about managing their reputation, doing market research, or getting a pulse on what customers are saying.
- Key Limitations: These tools can be pricey and might be overkill for smaller businesses whose main goal is just to track their own content performance.
Comparison of Social Media Analytics Tools
Picking the right tool depends on your specific goals, team size, and budget. This table breaks down the main options to help you see where your needs fit best.
| Tool Type | Examples | Best For | Key Limitations |
|---|---|---|---|
| Native Tools | Meta Business Suite, X Analytics, TikTok Analytics | Beginners, small businesses, basic single-platform insights. | No unified view; time-consuming to compare data across channels. |
| All-in-One Suites | Repostly, Sprout Social, Hootsuite | Businesses managing multiple channels; seeking efficiency and holistic insights. | Can be an added cost; might have a learning curve. |
| Specialized Tools | Brandwatch, Talkwalker | Large enterprises focused on brand reputation and market research. | Often expensive and complex; provides more data than most need. |
Ultimately, the best tool is the one that gives you the clarity you need to make better decisions without overwhelming you with data you won't use.
If you're ready to explore your options in more detail, our guide to the https://repostly.app/blog/social-media-analytics-tools-689848da650d8992d6cf6f2d is a great next step. Finding the right fit is all about matching a tool's capabilities to what your business truly needs.
Putting Your Social Media Data to Work

Okay, so you have the data. That's the first step. But the real magic happens when you actually use it. This is where we move from just looking at numbers to making smart moves that help your business grow.
This isn't about needing a Ph.D. in statistics. It’s about using data to answer real-world questions: How do we really stack up against our competitors? What are people saying about our new product? When should we even be posting? And the big one—is any of this actually moving the needle?
Perform a Simple Competitive Analysis
One of the best things you can do with data analytics in social media is to see where you stand in your field. A good old-fashioned competitive analysis helps you benchmark your own performance and, more importantly, spot opportunities your rivals are missing. Think of it as getting a peek at their playbook.
First, pick two or three of your main competitors. For the next month, track these simple metrics for their accounts and your own:
- Audience Growth Rate: Are they gaining followers at a faster clip? That could mean their content strategy is hitting the mark.
- Engagement Rate: Compare their average likes, comments, and shares to yours. If theirs is higher, their content might be more compelling or relevant.
- Posting Frequency: How often are they showing up? This gives you a sense of the standard rhythm for your industry.
- Content Themes: What topics or post formats are they using that seem to be working? Look for patterns in their home-run posts.
Just this simple exercise can show you where the gaps are in your own strategy or confirm where you’re already ahead of the game.
Use Sentiment Analysis to Check Your Brand Reputation
Sentiment analysis is basically taking your brand's temperature online. It's the process of tracking mentions of your company, products, or campaigns and sorting them into positive, negative, or neutral buckets. This gives you a fantastic bird's-eye view of how people feel about you.
Imagine a local coffee shop rolls out a new lavender latte. By tracking social media mentions, they can instantly see if customers are excited ("This is the best thing ever!") or... less than thrilled ("Tastes like soap!").
Sentiment analysis is your early warning system. It helps you catch negative feedback before it turns into a firestorm and highlights what your customers absolutely love so you can do more of it.
It's a direct line to understanding the emotional response to your marketing, and the feedback is pure gold for product development and customer service.
Pinpoint the Perfect Time to Post
Posting when your audience is actually online is one of the easiest wins in social media. You can boost your reach and engagement without creating a single new piece of content. Your social media analytics dashboard is a treasure trove for this. Most platforms give you a clear breakdown of when your followers are most active, hour-by-hour and day-by-day.
Just look for the peaks in the data—those are your golden hours. For example, you might find your audience is scrolling heavily during their lunch break from 12 PM to 1 PM on weekdays but is completely checked out on Saturday afternoons.
But don't just set it and forget it. Use this data as your starting point, then experiment. Try posting just before, during, and right after those peak times to see what truly gets the best results. A tiny tweak to your schedule can make a massive difference in how many eyeballs land on your content.
Accurately Track Your Campaign ROI
At the end of the day, every bit of effort on social media should connect back to a business goal. Tracking your Return on Investment (ROI) is how you prove your work is paying off. This means looking beyond likes and shares and connecting social media activity to tangible business outcomes.
To do this right, you have to track conversions. Here are a few practical ways to do it:
- Use UTM Codes: These are just little tracking snippets you add to links you share on social media. They let you see in Google Analytics (or a similar tool) exactly how many website visitors, leads, or sales came from a specific tweet or Instagram post.
- Create Custom Landing Pages: For a big campaign, send all your social traffic to a unique landing page. This makes it incredibly easy to see how many leads or sales that specific campaign generated.
- Leverage Platform Pixels: Install tracking pixels, like the Meta Pixel, on your website. This lets you track what people do after seeing your ads, whether it's making a purchase or signing up for your newsletter.
For instance, a startup launching a new app could track their campaign hashtag to gauge buzz while using UTM links in their bio to count every single sign-up that came directly from their social channels. By connecting those dots, they can clearly show how social media made a real impact.
From Social Insights to Smarter Business
This is where it all clicks into place. We’ve journeyed through the world of data analytics in social media, and it’s clear this is so much more than a marketing task—it’s a core part of your business intelligence. By starting with the basic ideas and moving into a real-world workflow, you’ve laid the groundwork for making smarter, more confident decisions.
The best advice I can give is to start simple. Don't feel pressured to track every single metric right out of the gate.
Instead, pick a few key performance indicators that genuinely connect to your business goals. Get comfortable with those, nail down your process, and then you can start branching out.
The Path From Data to Decisions
When you truly start listening to your social data, you open up a direct line of communication with your customers. That connection is gold for a few big reasons:
- Refining Products: You get honest feedback on what people love (and what they don't), giving you clear direction on how to make your products better.
- Improving Services: You can spot common frustrations or questions early, letting you smooth out the customer experience before problems escalate.
- Building a Resonant Brand: In a noisy digital world, this data helps you craft a brand identity that actually means something to people.
Once you have the basics down, you’ll start to see a natural feedback loop form, where each insight makes your strategy a little bit stronger. To see this in action, you can explore marketing case studies and see how other businesses turned data into real-world wins.
Ultimately, social media analytics is about trading guesswork for a predictable growth model. It’s a commitment to listening to your audience, understanding what they truly need, and delivering on it, time and time again.
That consistency is what builds lasting success. For more practical tips on this, check out our guide on how to increase social media engagement. Putting these ideas into practice is how you turn raw numbers into a community that grows with you.
Frequently Asked Questions
Jumping into social media analytics can feel a little overwhelming, and it's natural to have questions. Let's clear up a few of the most common ones so you can get started with confidence.
How Often Should I Analyze My Social Media Data?
The honest answer? It depends on what you're trying to figure out. Consistency is what really matters.
For day-to-day stuff like checking post engagement or responding to comments, a weekly review is usually perfect. It helps you stay on top of the immediate conversations without getting lost in the numbers.
But when you're looking at the bigger picture—like campaign performance or audience growth—you need more data to see real trends. For that, a monthly or quarterly analysis is your best bet. Find a rhythm that works for you and stick with it.
What Is The Difference Between Social Listening and Analytics?
This is a great question, and it's easy to get them mixed up. They're related, but they do very different jobs.
Social media analytics is all about looking inward at your own channels. It answers questions like, "How did our last post do?" or "Are we gaining followers?" You're essentially analyzing your own report card.
Social listening, on the other hand, is about looking outward. It’s about tuning into the broader conversations happening across all of social media—not just on your pages. It helps you understand what people are saying about your brand, your competitors, and your industry as a whole.
Think of it this way: analytics is like looking in a mirror to check on your own performance—your likes, shares, and follower growth. Social listening, on the other hand, is like opening a window to hear what the entire neighborhood is saying about you, your competitors, and your industry.
How Can I Start Analytics On a Small Budget?
Good news: you don't need a big budget to get started. In fact, you can start for free.
Every major social media platform has its own built-in analytics tools, and they're surprisingly powerful.
- Instagram Insights: A goldmine for understanding your follower demographics and seeing which content truly resonates.
- Meta Business Suite: Gives you a comprehensive dashboard for all things Facebook and Instagram.
- TikTok Analytics: Essential for tracking video views, profile visits, and what’s trending with your audience.
Start there. Get comfortable with the data these platforms give you. You can even track the most important numbers in a simple spreadsheet. This hands-on approach is the best way to learn the ropes before you even think about paying for a tool.
Ready to stop juggling platforms and see all your social media data in one place? Repostly unifies your analytics, automates your posting, and saves you hours every week. Start your free 7-day trial today and see the difference.
Keep reading

10 Fresh Instagram Story Idea Tactics for 2025
Stuck for content? Discover our top Instagram story idea list, with actionable tips to boost engagement and grow your audience in 2025.

A Practical Social Media Planner for German Markets
Build a results-driven social media planner for Germany. This guide offers actionable strategies for content, scheduling, and analysis in the German market.

Crafting Your Social Media Content Plan
Stop guessing and start strategizing. This guide provides an actionable social media content plan to audit, plan, and execute content that gets results.
Post once. Show up everywhere.
Start your 7-day free trial and publish your next video to every platform in minutes.Pick a plan and publish your next video to every platform in minutes.
Start your free trialSee plansCancel anytime