Mastering Digital Marketing Performance Metrics
Unlock growth by mastering digital marketing performance metrics. This guide explains how to track, analyze, and optimize your campaigns for measurable success.

Think of digital marketing metrics as the vital signs for your campaigns. They are the hard numbers—like website traffic, conversion rates, and return on investment—that tell you what's working, what's falling flat, and where your opportunities lie. They replace guesswork with a clear, data-driven strategy.
Why Metrics Are Your Marketing Compass
Trying to market online without metrics is like sailing across the ocean without a compass. Sure, you're moving, but are you actually getting any closer to your destination? Digital marketing metrics are your navigational tools, giving you a clear map of your campaign's journey and its real-world impact.
When you track the right data, your marketing stops being an unpredictable cost and starts becoming a reliable, revenue-generating engine. Every click, view, and conversion tells a piece of your customer's story. This empowers you to make confident decisions that guide your business towards genuine growth, which is more important than ever in today's crowded market.
The Value of Measurement
In a competitive market, truly understanding your performance gives you a serious edge. Take the German digital advertising market, for instance. It's expected to grow by around 10% in 2025, with eRetailer advertising projected to jump by a massive 24%. This kind of growth means there's a huge opportunity, but only for those who can measure and adapt effectively to capture it.
By consistently measuring your efforts, you can:
- Justify Marketing Spend: Show stakeholders exactly how their investment is paying off.
- Optimise Your Strategy: Pinpoint underperforming channels and shift your budget to what actually works.
- Understand Your Audience: Uncover deep insights into how your customers behave and what they really want.
"At the simplest level, you need to measure what you set out to achieve with your marketing objectives."
This is the cornerstone of effective marketing. If your metrics aren't tied to your goals, your activities are just noise. It all begins by understanding how different data points connect and tell a bigger story. Establishing a solid framework is key, and our guide on https://repostly.app/blog/metrics-and-reporting-6890598a44be737efa9f3b40 can help you get started.
To make sure your metrics are more than just a vanity display, you need to go beyond surface-level numbers. The real goal is building an effective business performance metrics dashboard that delivers actionable insights. That's how you turn raw data into a strategic asset that guides every decision you make.
To help you get your bearings, let's break down the main categories of digital marketing metrics. This table gives you a quick overview of what each category focuses on, so you know where to look for the right data.
Key Metric Categories at a Glance
| Metric Category | Primary Goal | Example Metrics |
|---|---|---|
| Traffic Metrics | Measure website and page visibility | Unique Visitors, Page Views, Traffic Sources, Bounce Rate |
| Engagement Metrics | Gauge audience interaction with your content | Likes, Shares, Comments, Time on Page, Click-Through Rate |
| Conversion Metrics | Track the completion of desired actions | Conversion Rate, Cost Per Conversion, Leads, Sales |
| Revenue Metrics | Evaluate financial performance and profitability | Return on Investment (ROI), Customer Lifetime Value (CLV) |
Understanding these categories is the first step. It helps you organise your thinking and ensures you’re tracking a balanced set of numbers that give you a complete picture of your marketing performance.
Turning Clicks into Customer Conversations
Think of every click on your website as a piece of a conversation. It’s easy to get fixated on the final sale, but the real magic happens when you learn to understand the basic traffic metrics. These numbers are like your audience's digital body language, telling you who’s showing up and what they’re doing when they get there.
Let’s start with two of the most fundamental digital marketing performance metrics: Users and Sessions. A User is simply a unique person who stops by your site. Picture them as an individual customer walking into your physical shop for the first time. A Session, on the other hand, is everything that person does during one complete visit—like browsing a few aisles, checking out a product, and maybe asking a question.
That one user can come back several times, creating multiple sessions over a week or a month. Understanding the difference is crucial. A lot of sessions from a small group of users? That could signal a loyal fanbase that keeps returning. But if you have a ton of new users who only visit once, you might be great at getting attention but not so good at holding it.
What Are Your Visitors Really Doing?
Just getting people to your site isn't enough; you need to know if they're actually engaging with what you've built. This is where you look at metrics that measure the quality of your traffic. After all, a crowd of visitors means very little if they aren't interested in what you have to offer.
Here are a couple of key metrics that tell this story:
- Average Session Duration: This is exactly what it sounds like—the average amount of time someone hangs around on your site during a visit. Generally, a longer duration means your content is hitting the mark and keeping them interested.
- Bounce Rate: This one tracks the percentage of visitors who land on a single page and then leave without clicking anything else. Imagine someone walking into your shop, glancing around for two seconds, and immediately turning around to leave.
A high Bounce Rate isn't just a number; it’s your audience telling you something is wrong. It often means the page they landed on didn't deliver on the promise of the ad or search result that brought them there.
For instance, a high bounce rate on a product page could mean anything from the price being a shock to the page taking too long to load. Each clue points you toward a specific fix. The real power of these digital marketing performance metrics comes from looking at them together. If you see a low average session duration and a high bounce rate, that's a massive red flag telling you your landing page experience needs a complete rethink.
Measuring Real Impact on Social Media

It’s easy to get lost in the sea of numbers that social media platforms throw at you. Chasing likes and follows, what many call vanity metrics, can feel productive. They look great on a report, but they often fail to paint a complete picture of your actual business performance.
Real success on social media comes down to understanding how your audience genuinely interacts with what you post. More importantly, it’s about how those interactions help you achieve your business goals. This means we need to shift our focus from the superficial stats to the digital marketing performance metrics that truly show our impact. It’s not just about counting followers; it's about asking what those followers are doing.
Moving Beyond Vanity Metrics
The metrics that matter are the ones that link your social media activity to tangible results—things like website visits, new leads, or actual sales. These are the numbers that give you the insights to fine-tune your strategy and prove your work is paying off. By focusing on them, you start to understand what really clicks with your audience.
Here are the key metrics you should be watching:
- Engagement Rate: This shows the percentage of your audience that interacts with your content through likes, comments, or shares. It’s a fantastic way to gauge how interesting your posts are and whether your content is hitting the mark.
- Click-Through Rate (CTR): CTR tells you how many people clicked a link in your post. This is a direct measure of your ability to pull people away from the social feed and onto your website or a landing page.
- Shares: A share is a personal endorsement. When someone shares your content, they’re telling their own network, "Hey, this is worth looking at." It’s a powerful signal of value that expands your reach in the most authentic way possible.
The most valuable social media metrics are those that demonstrate a user took a meaningful step beyond passive consumption. A share is a recommendation, a click is an action, and a comment is a conversation.
Understanding Reach and Impressions
To put your engagement numbers into perspective, you also need to track Reach and Impressions. Think of it this way: Reach is the number of individual people who see your content. Impressions are the total number of times your content was shown on a screen, even if the same person saw it multiple times. A high impression count with low reach can mean the same small group is seeing your post over and over.
Keeping a close eye on these figures is crucial because the social media world is constantly changing. For example, in Germany, Meta's platforms are still major players, with Facebook boasting a potential ad reach of 24.5 million users in early 2025. However, that same number dropped by 4.9% in just a few months, which shows just how fast audience dynamics can shift.
Of course, tracking these deeper metrics requires a good system. To make sense of all this data, it’s worth exploring some of the best social media analytics tools out there. The right platform can turn a flood of raw numbers into a clear roadmap, helping you adapt your strategy to make sure every post finds its audience.
Connecting Your Marketing to Real Money
Alright, let's get to the good part: proving your marketing efforts are actually making the company money. Clicks, likes, and shares are great for vanity, but they don't pay the bills. The real story is told by the numbers that directly link your campaigns to the bottom line.
These are the digital marketing performance metrics that get the attention of stakeholders and budget holders. When you can walk into a meeting and show exactly how your work impacts revenue, you're no longer seen as a cost centre. You're a growth engine.
The Revenue Metrics That Matter Most
To draw that straight line from your marketing spend to actual income, you need to get comfortable with a few key calculations. These aren't just numbers on a spreadsheet; they tell you precisely what you're getting back for every euro you put in.
Conversion Rate: Think of this as your "persuasion score." It’s the percentage of people who take the action you want them to, whether that's buying a product or signing up for a newsletter. A high conversion rate means your message is hitting the mark.
Cost Per Acquisition (CPA): This is your efficiency metric. It tells you, on average, exactly how much you had to spend to win one new customer. The lower your CPA, the more profitable your marketing is.
Return on Investment (ROI): This is the ultimate proof of success. ROI measures the total revenue you brought in against what you spent to get it. It directly answers the big question: "Was it worth it?"
It's surprising how many teams skip this crucial step. Research shows that over a third of marketers (34.2%) admit their company rarely or never measures marketing ROI. That's a huge blind spot in understanding what's actually working.
Let’s Break It Down: A Real-World Example
Imagine you're running an e-commerce shop based in Germany. You've just launched a new social media ad campaign to promote a new line of products.
- You spend a total of €1,000 on the ads.
- The campaign drives 5,000 people to your product page.
- From those visitors, 100 people end up buying something.
- The total sales from those purchases add up to €4,000.
So, how did you do? Let's crunch the numbers:
- Conversion Rate: (100 Purchases / 5,000 Visitors) x 100 = 2%
- Cost Per Acquisition (CPA): €1,000 Ad Spend / 100 New Customers = €10 per customer
- Return on Investment (ROI): ((€4,000 Revenue - €1,000 Cost) / €1,000 Cost) x 100 = 300%
A 300% ROI is fantastic! It’s hard evidence that your campaign was a huge success. This kind of data-first approach is central to the European digital marketing analytics market, which was valued at around €1.36 billion in 2024, with Germany being a major player.
When it comes to paid advertising, you'll want to dig even deeper. For that, you need to Master Advertising Performance Metrics to Boost Your ROI.
If you want an even easier way to figure out the profitability of your social media, we’ve got you covered. Check out our guide on using a social media ROI calculator to turn your marketing from a guess into a proven revenue driver.
Choosing the Right Metrics for Your Goals
Let's get one thing straight: not all marketing metrics are created equal. The ones that truly matter depend entirely on what you're trying to achieve. Picking the wrong metrics is like using a road map of Berlin to navigate Munich – you have information, sure, but it's completely useless for getting you to your destination.
Before you even think about building a dashboard, you have to define what success actually looks like for your campaign. Are you trying to get your name out there and introduce your brand to a whole new crowd? Or are you focused on driving immediate sales for a specific product? Each of these goals needs a totally different set of signposts to tell you if you're on the right track.
Aligning Metrics with Your Objectives
The secret is picking Key Performance Indicators (KPIs) that directly tie back to your main objective. A classic mistake I see all the time is marketers getting sidetracked by "vanity metrics" – things like a high number of likes on a social media post – when their real goal is to generate qualified leads. This kind of disconnect means you end up pouring time and money into activities that don't actually move the needle, and you'll struggle to prove your marketing's real worth.
Let's break it down with a few common scenarios:
Goal: Brand Awareness. If your mission is simply to get your brand in front of as many relevant eyeballs as possible, then you'll live and die by metrics like Reach and Impressions. These tell you just how wide you're casting your net.
Goal: Lead Generation. Need to fill that sales pipeline? Your focus has to shift. Now, the stars of the show are your landing page Conversion Rate and your Cost Per Lead (CPL). These tell you how efficiently you're turning visitors into potential customers.
Goal: Direct Sales. For an e-commerce business, it all comes down to the bottom line. The story is told through revenue, making Return On Ad Spend (ROAS) and Customer Acquisition Cost (CAC) the most crucial numbers on your screen.
Think of it this way: choosing the right metrics isn't about tracking everything you possibly can. It's about tracking the few things that give you the most clarity. Your dashboard should be a spotlight, not a floodlight, perfectly illuminating the path to your specific goal.
This visual helps put some of the most common metrics into perspective.
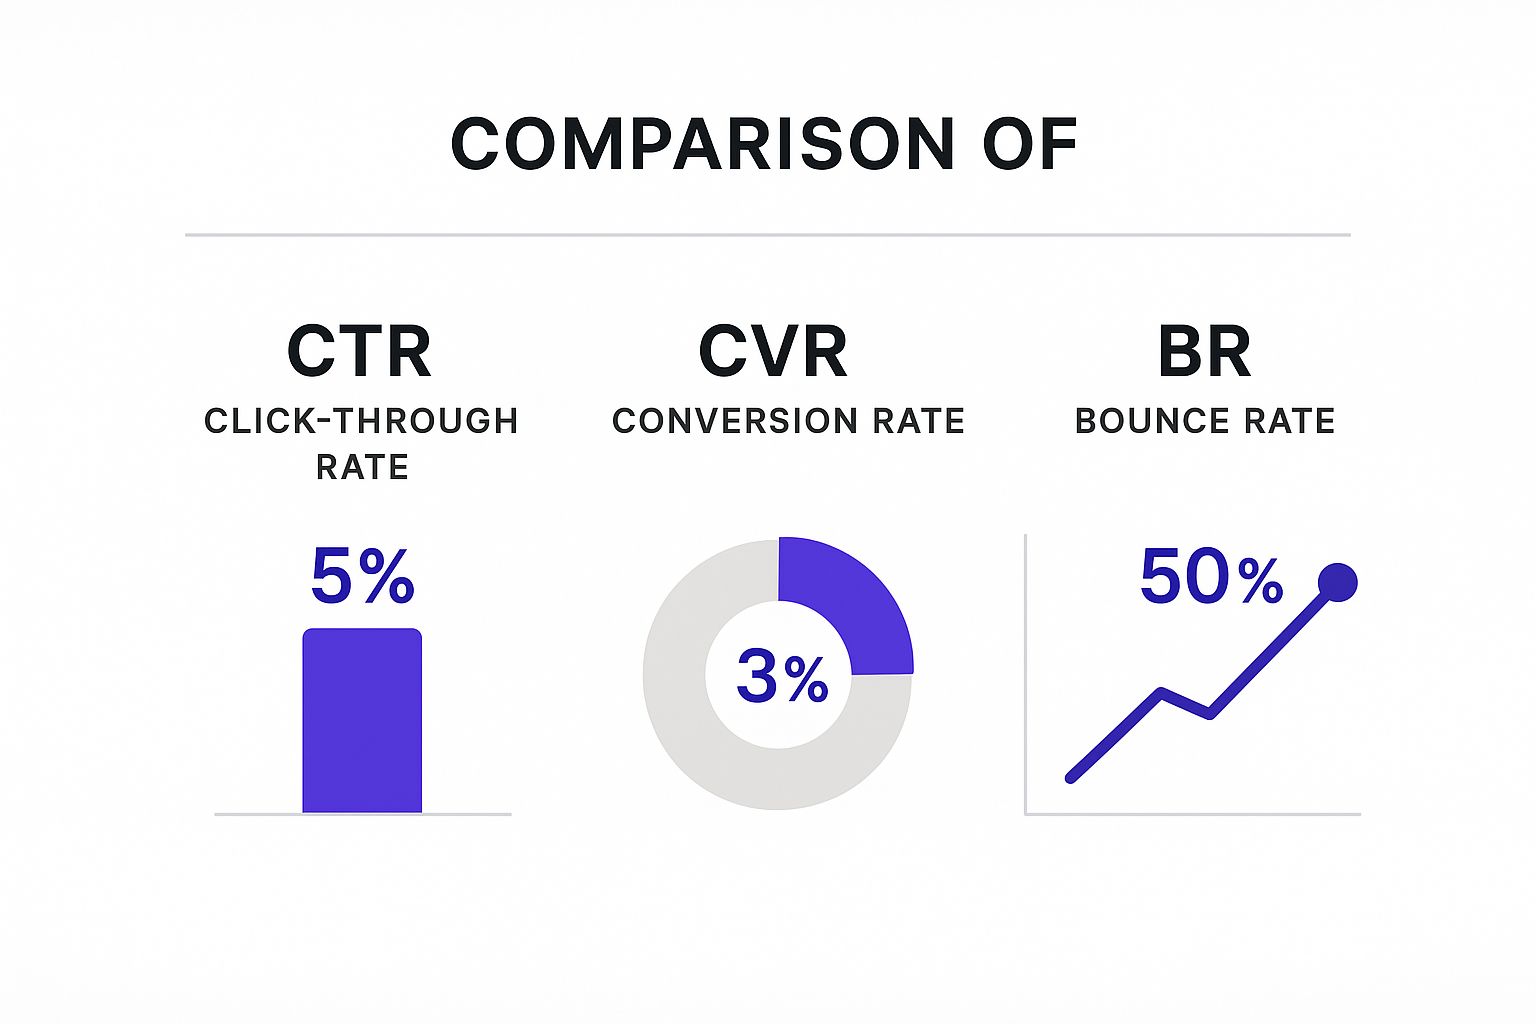
As you can see, metrics like Bounce Rate tend to have much higher percentages than Click-Through or Conversion Rates. Seeing them side-by-side helps set realistic benchmarks for what "good" performance actually looks like.
A Practical Comparison
To make this really concrete, here’s a table that lays out how you'd approach measurement for different campaigns. It’s designed to help you quickly match your own marketing objectives to the KPIs that will give you the most meaningful insights.
Matching Metrics to Marketing Objectives
| Marketing Objective | Primary KPIs | Secondary Metrics |
|---|---|---|
| Brand Awareness | • Reach • Impressions • Video View Rate |
• Website Traffic • Social Media Follows • Branded Search Volume |
| Lead Generation | • Conversion Rate • Cost Per Lead (CPL) |
• Click-Through Rate (CTR) • Form Abandonment Rate |
| Drive Direct Sales | • Return On Ad Spend (ROAS) • Customer Acquisition Cost (CAC) |
• Average Order Value (AOV) • Cart Abandonment Rate |
| Customer Engagement | • Engagement Rate (Likes, Comments, Shares) • Time on Page |
• Session Duration • Pages per Session • Repeat Visitor Rate |
By tailoring your performance metrics to each specific objective, you create a powerful and actionable feedback loop. It's this focused approach that helps you understand what's genuinely working, allowing you to make smart, data-driven decisions that give you the biggest bang for your buck. You'll know that every marketing euro is being spent wisely.
Your Questions on Marketing Metrics Answered

As you start putting these ideas into practice, you're bound to have a few questions pop up. That’s perfectly normal. This last section tackles some of the most common things people ask about digital marketing metrics. It’s designed to be a quick-reference guide to help you clear up any confusion and move forward with your strategy.
Getting these fundamentals right is what separates a good measurement plan from a great one. The more clarity you have, the better you'll be at tracking what actually moves the needle for your business.
What Is the Difference Between a Metric and a KPI?
It's really common to hear these two terms used as if they mean the same thing, but there’s a crucial difference in their roles.
A metric is just a number—a simple, quantifiable measurement. For example, 'website visits' is a metric that almost every business with a website tracks. It's a useful piece of information, sure, but by itself, it doesn't tell you if you're succeeding.
A Key Performance Indicator (KPI), on the other hand, is a very specific metric that you’ve hand-picked because it directly measures your progress towards a major business goal. Think of it like this: all KPIs are metrics, but only your most critical, goal-oriented metrics get to be called KPIs.
A metric tells you what happened. A KPI tells you if you're on track to hit your most important goals.
So, while 'website visits' is a perfectly fine metric, a business focused on lead generation might choose 'new qualified leads from organic search' as a KPI. This is because it’s directly tied to a business outcome and gives a much clearer signal of whether your marketing is truly working.
How Often Should I Check My Marketing Metrics?
There’s no magic number here. The right rhythm for checking your metrics really depends on the pace and type of campaigns you’re running. You need to match your monitoring schedule to the data you’re looking at.
Daily Checks: This is non-negotiable for fast-moving paid ad campaigns. Things like Cost Per Click (CPC) and daily ad spend can swing wildly overnight. Checking them daily lets you make quick adjustments and stops you from wasting your budget.
Weekly Reviews: This is a great cadence for things like content performance and social media engagement. Looking at blog traffic or email open rates on a weekly basis gives you a solid view of trends without getting bogged down by tiny, insignificant daily fluctuations.
Monthly and Quarterly Reports: For the big picture, you need to zoom out. Broader strategic goals and their corresponding KPIs, like organic search rankings, Customer Lifetime Value (CLV), or overall brand awareness, are best reviewed monthly or quarterly. This helps you spot meaningful patterns and make smart, strategic shifts.
The goal is to find a consistent schedule that allows you to be responsive without being reactive. It helps you stay agile enough to act on important changes while ignoring the meaningless day-to-day noise.
Which Tools Are Best for Tracking Marketing Performance?
The "best" toolset really comes down to your specific channels, goals, and budget. That said, most solid tracking setups are built on a foundation of a few core platforms.
For anything related to your website's performance, Google Analytics is the absolute industry standard. It’s an essential tool for getting deep insights into your traffic and how users behave on your site. When it comes to SEO, you'll need something more specialised like Semrush or Ahrefs to keep an eye on keyword rankings, backlinks, and what your competitors are up to.
For social media, every platform has its own built-in analytics dashboard (like Meta Business Suite or LinkedIn Analytics), and they're pretty robust. But if you’re active on multiple channels, using a third-party tool can be a game-changer, pulling all your data into one place to make cross-platform analysis much, much easier.
Ready to take control of your social media performance? Repostly centralises your analytics from TikTok, Instagram, YouTube, and more, so you can stop guessing and start growing. Save time and get clearer insights by visiting https://repostly.app to see how it works.
Keep reading

10 Fresh Instagram Story Idea Tactics for 2025
Stuck for content? Discover our top Instagram story idea list, with actionable tips to boost engagement and grow your audience in 2025.

A Practical Social Media Planner for German Markets
Build a results-driven social media planner for Germany. This guide offers actionable strategies for content, scheduling, and analysis in the German market.

Crafting Your Social Media Content Plan
Stop guessing and start strategizing. This guide provides an actionable social media content plan to audit, plan, and execute content that gets results.
Post once. Show up everywhere.
Start your 7-day free trial and publish your next video to every platform in minutes.Pick a plan and publish your next video to every platform in minutes.
Start your free trialSee plansCancel anytime