How to Check Instagram Analytics for Real Growth
Learn how to check Instagram analytics with our guide. Turn Instagram Insights into an actionable strategy to grow your audience and boost engagement.
Ready to really understand what’s working on your Instagram? The first step is getting access to the data. This means you’ll need to switch your account to a Professional Account, which you can do for free right in your settings. It’s a simple flip of a switch that opens up a whole new world of insights.
Once you've done that, you'll see a "Professional dashboard" link right on your profile. Tapping that is your gateway to Instagram Insights, the platform's own analytics tool. This is where you'll find all the juicy details about your content, your audience, and how people are interacting with your account.
Why Bother With Analytics?
Honestly, trying to grow an Instagram account without looking at your analytics is like driving with your eyes closed. You might post something you think is brilliant, but the numbers will tell you the real story of what your audience actually stops scrolling for.
Making decisions based on real data instead of just a gut feeling is what separates stagnant accounts from the ones that see real, consistent growth.
Tapping Into Instagram Insights
That little switch to a Professional Account is your key to unlocking Instagram Insights. It's the go-to tool for the 200 million+ businesses on the platform, and for good reason. It gives you a direct look at the metrics that matter most.
Right away, you'll be able to see things like:
- Who's Seeing Your Stuff: Get a clear picture of your Reach (how many unique people saw your post) and Impressions (the total number of times it was seen).
- What People Are Doing: Track your engagement—the likes, comments, saves, and shares. This tells you what content truly connects with your audience.
- Who Your Audience Is: Learn about your followers' demographics, like where they live, their age range, and even the specific times they're most active online.
This is the foundational data you need to start fine-tuning your strategy. When you start applying this information, the impact can be huge, as you can see from some of the wider Instagram stats put into practice at DataReportal.
To make sense of all this, it helps to have a quick cheat sheet for what these core metrics actually mean for you.
Here's a quick reference guide to the most important metrics you'll find in Instagram Insights and why they matter for your strategy.
| Metric Name | What It Measures | Why It's Important |
|---|---|---|
| Reach | The total number of unique accounts that have seen your content. | This is your true audience size. High reach means you're getting your content in front of more people. |
| Impressions | The total number of times your content was displayed to users. | Impressions can be higher than reach if people see your content more than once. It shows how "sticky" your content is. |
| Engagement Rate | The percentage of your audience that interacted with a post (likes, comments, shares, saves). | A key indicator of content quality. High engagement means your content is resonating with your followers. |
| Saves | The number of times users have saved your post to their personal collections. | This is a powerful metric! It shows your content is valuable enough for people to want to come back to it later. |
| Follower Growth | The net change in your follower count over a specific period. | A straightforward measure of your account's growth trajectory. Are you gaining or losing followers? |
| Profile Visits | The number of times your profile has been viewed. | Shows that your content is compelling enough to make someone want to learn more about you. |
Think of this table as your starting point. As you get more comfortable with the basics, you'll start to see how these numbers connect and tell a bigger story about your account's health and performance.
Finding Your Way Around Instagram Insights
Once your professional account is up and running, getting to your analytics is a breeze. Just head to your profile page and look right under your bio for the "Professional dashboard" link. Tapping that drops you straight into Instagram Insights, which is the platform's own command center for all your data.
Instead of throwing a confusing wall of numbers at you, Instagram neatly organizes everything into a few core areas. Understanding these is the first real step to making smart decisions based on what's actually working.
Navigating the Core Insight Tabs
Think of your dashboard as having three main sections, each telling a different part of your account's story.
- Content: This is where you can zoom in on individual posts, Stories, and Reels. I find it super helpful for sorting by a specific metric, like reach or saves, to quickly spot my best-performing content over the last week or month.
- Activity: This tab is all about how people are interacting with your account as a whole. You'll find numbers on profile visits and website clicks, which are great indicators that people are curious enough to learn more.
- Audience: Honestly, this is where the gold is. It gives you a complete demographic picture of your followers—their top locations, age ranges, gender, and, most crucially, the exact times they are most active on Instagram.
This screenshot shows the "View Insights" button you can tap directly on a post to see how it's doing.
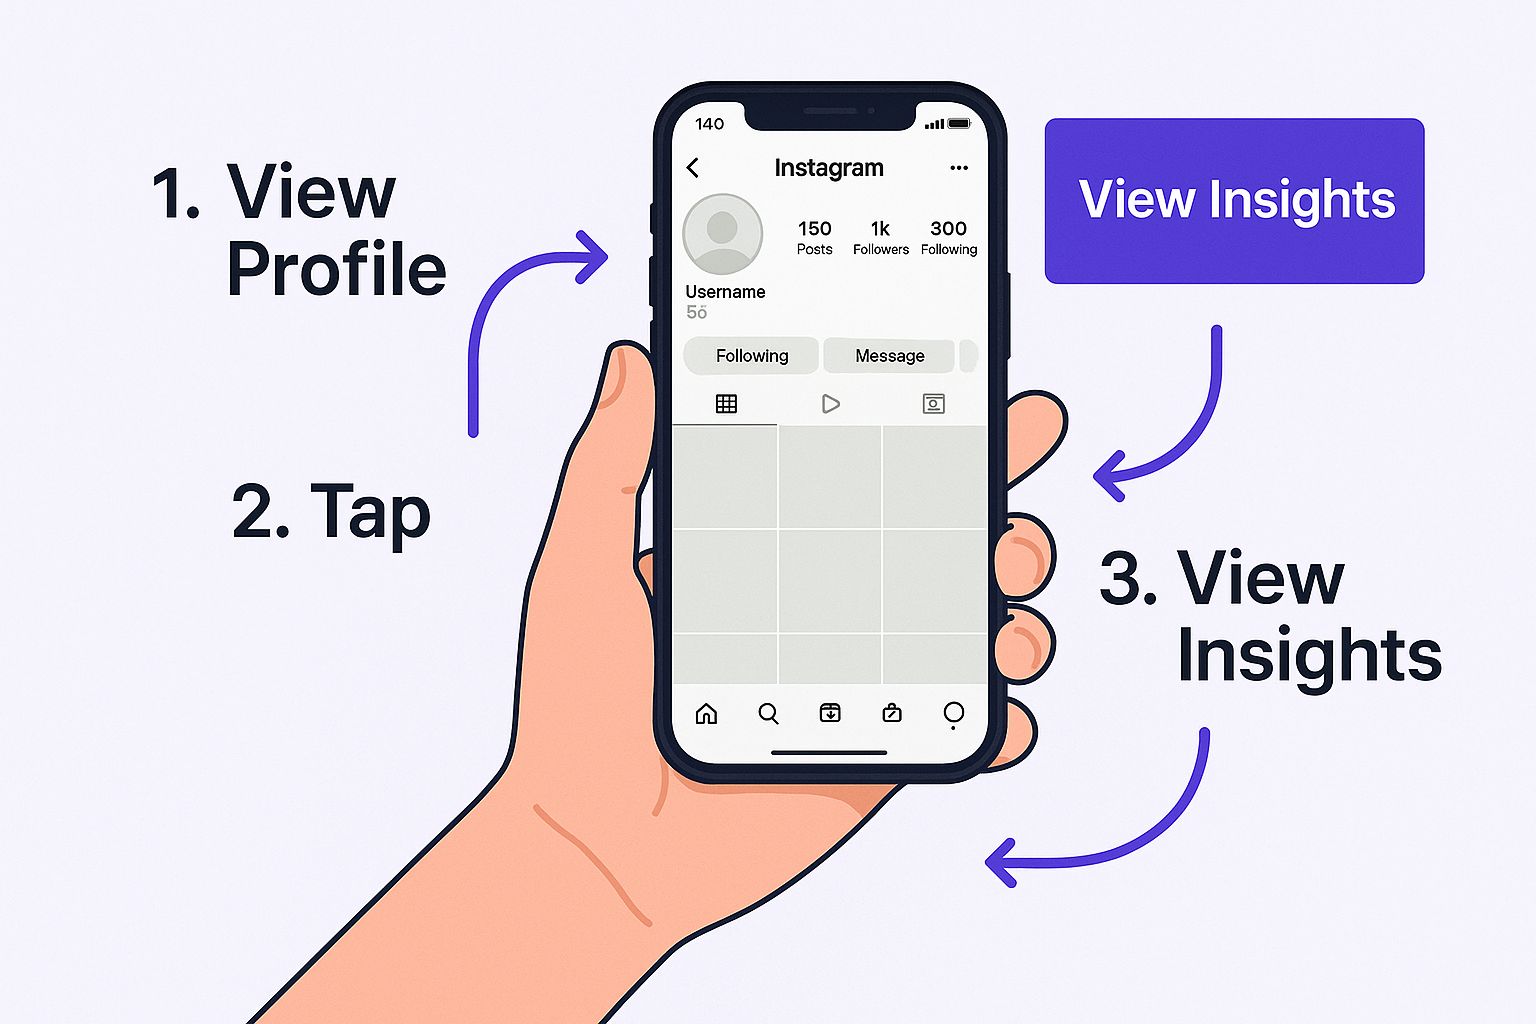
Hitting that button instantly pulls up all the key stats for that piece of content, like its likes, comments, and reach.
Pro Tip: A common mistake I see is getting fixated on likes. The real insights that drive growth are usually hiding in the 'Activity' and 'Audience' tabs. They tell you who is engaging and why certain content resonates.
From Data Points to Actionable Steps
The real skill is learning to connect the dots between these different data points. For example, let's say you check the 'Content' tab and see that a Reel showing a "behind-the-scenes" look at your process got double your usual reach.
That's a great start. But then you can jump over to the 'Audience' tab to see what time you posted it. Did it happen to go live right when your followers are most active? Bingo. This simple cross-check tells you exactly what kind of content to create and the best time to share it.
While Instagram's built-in tool is fantastic for these quick checks, looking into other social media analytics tools can give you a much deeper, more historical view of your performance over time.
Turning Your Content Metrics into a Strategy
Knowing how to find your Instagram analytics is the easy part. The real skill is turning those numbers into a smart, effective content strategy. Because let's be honest, data without a story is just noise. Your job is to figure out what that story is—what your audience really wants to see from you.
Different metrics tell you different things. A high number of Saves, for instance, is a gold star. It means you created something so valuable people want to come back to it later. Think recipes, DIY tutorials, or workout routines. That's sticky content.
A spike in Shares on a Reel, on the other hand, tells a different story. It means you hit a nerve—your content was so relatable, funny, or shocking that people felt compelled to send it to their friends. That's how you go viral and tap into brand new audiences.
Decoding Different Content Formats
Every format on Instagram gives you a different clue. Let's imagine a local coffee shop posts a mix of content: polished, professional photos of their lattes and casual, behind-the-scenes Stories of their baristas. They soon notice the informal Stories get double the engagement.
That's not a coincidence; it's a direct message from their followers. The data is practically screaming, "We love seeing the real people behind the coffee!" This insight immediately gives them a clear path forward: more authentic, day-in-the-life content to build a genuine connection. This is what a data-informed strategy looks like in the real world.
A common mistake is lumping all engagement into one bucket. A 'Save' often carries more weight than a 'Like.' It signals deeper value and helps you build a loyal community, not just chase vanity metrics.
Turning Insights Into Actionable Steps
So, how do you turn these little observations into a repeatable plan? It's simpler than you think. If your carousel posts consistently get more interaction than your single-image posts, it's time to double down.
This isn't just a hunch; the data backs it up. A massive analysis of 31 million posts found that carousels often have the highest engagement rates, which is why so many successful creators lean on them. If you're a data nerd, you can dig into more of these benchmarks from Socialinsider.
Start by playing detective with your best-performing posts. Ask yourself why they worked.
- Was it the format? Maybe your audience loves swiping through a carousel more than watching a Reel.
- Was it the topic? Did that personal story resonate more than the sales pitch?
- Was it the timing? Did you post during the morning commute or late-night scroll session?
When you start answering these questions, you stop guessing and start building a real formula for success. For a deeper dive into this process, check out our guide on https://repostly.app/blog/data-analytics-in-social-media-68aed59844be737efa9f3cc5. And when you're ready to go beyond Instagram's built-in tools, platforms like Hypefactors can help you analyze your content performance on a much deeper level.
Taking Your Analytics to the Next Level with Repostly
Instagram’s built-in Insights are a great place to start, but eventually, you'll hit a wall. One of the biggest limitations? It only holds onto your data for the last 90 days. This makes it nearly impossible to spot long-term trends or compare your performance to the same time last year.
That’s exactly where a dedicated tool like Repostly comes in. If Instagram Insights is like a quick check-up, Repostly is the full-body scan. It gives you the kind of in-depth data that lets you move from just posting content to building a real strategy.
Imagine trying to pull together a quarterly performance report using only the Instagram app. You'd be stuck taking endless screenshots and manually plugging numbers into a spreadsheet. With a tool like Repostly, you can generate a clean, professional PDF report for any custom date range you need, all in just a couple of clicks.
Deeper Dives and Better Reports
It’s not just about saving time; it's about gaining a clearer picture. Third-party platforms give you powerful features that Instagram simply doesn't offer, helping you build a smarter, more effective social media plan.
Here’s a taste of what you can do:
- Keep Your Data Forever: As soon as you connect your account, Repostly starts archiving your performance data. No more 90-day limits. You can look back and analyze your growth over years, not just a few months.
- See What Your Competitors Are Doing: You can actually track how your competitors’ accounts are performing. This lets you benchmark your own growth and spot content strategies that are working for them (or find gaps they’re missing).
- Put Your Reporting on Autopilot: Set up weekly or monthly reports and have them sent straight to your email. This saves a massive amount of manual work and keeps you consistently on top of your performance.
As someone who has managed multiple client accounts, I can tell you that automated, branded reporting is a lifesaver. It instantly makes your service look more professional and shifts the conversation from "here's what we posted" to "here's the data-backed strategy for next month."
Ultimately, using a platform like Repostly helps you spend less time digging for data and more time actually using it to make smart decisions. For anyone serious about growing on Instagram, that shift is everything.
Putting Your Instagram Analytics Into Action
Alright, you’ve got the data. Now what? Knowing how to pull up your numbers is one thing, but the real magic happens when you turn those insights into an actual content strategy.
This is the shift from being a data-checker to a data-driven creator. Instead of just posting whenever you have a free moment, you start scheduling your content when your audience is most likely to see it—a golden nugget you can find right in your ‘Audience’ tab.
Turning Insights Into Experiments
One of the best ways to use your analytics is to run simple experiments. Think of it like a mini-competition for your content.
Let's say you have a great tip to share. One week, post it as a Reel. The next, try it as a carousel. Then, let the numbers tell you which one won. Did one format get way more saves? Did the other get more shares? Your audience is literally telling you what they want to see more of.
This mindset is everything. It stops you from guessing and helps you refine your strategy based on what actually works.
Here’s a pro tip: Set aside 30 minutes every single month to review your analytics. Look at your best-performing content and, most importantly, ask yourself why it did so well. This one habit will do more for your content intuition than anything else.
Creating a Sustainable Review Process
Your monthly check-in doesn't need to be some complex, spreadsheet-heavy task. Just look for the obvious patterns.
- Top Posts: Which posts got the most love (likes, comments, shares)?
- Follower Spikes: Did a specific post bring in a new wave of followers?
- Audience Activity: Are you still posting when your audience is most active, or have their habits changed?
Answering these questions consistently is the foundation for solid, organic growth. If you want to dig even deeper, we've got a whole guide on https://repostly.app/blog/how-to-grow-instagram-followers-organically-6892fe9e44be737efa9f3b5d with more advanced tactics.
Ultimately, the goal is to tie your Instagram performance back to real business outcomes. It’s not just about likes and follows; it’s about understanding how your social media work helps the bottom line. Learning how to measure your overall marketing ROI is what turns those vanity metrics into truly valuable business intelligence.
A Few Common Instagram Analytics Questions
Even when you know where to look, a few questions always seem to come up when you start digging into your Instagram analytics. Let's clear up some of the most common ones so you can feel confident about what the numbers are actually telling you.
One of the biggest head-scratchers is simply not being able to find the "Insights" option at all. If that’s you, don't worry—the fix is usually simple. You’re probably still using a Personal Account.
Instagram reserves its analytics tools for Professional Accounts, which includes both Business and Creator profiles. The good news? Switching is free, takes just a few seconds, and you can always switch back if you need to. Just head into your settings to make the change.
How Far Back Can I See My Data?
This is a big one. When you're using Instagram's built-in tools, you're a bit limited. You can only look at performance metrics for the last 90 days. While that’s fine for tracking recent campaigns, it makes it impossible to do any real year-over-year comparisons or spot long-term growth patterns.
If you want a bigger picture, a third-party analytics tool is the way to go. For example, a platform like Repostly starts saving your data the moment you connect your account. This gives you a complete historical record, so you can analyze trends over months or even years.
A Quick Tip on Reach vs. Impressions
It's easy to get these two mixed up, but the difference is critical for understanding your performance.Reach is the number of unique people who saw your post.
Impressions is the total number of times your post was seen.So, if 100 people see your post twice, your reach is 100, but your impressions are 200.
Why does this matter? High impressions with low reach might mean your existing followers are super engaged and seeing your content multiple times. Knowing this difference helps you figure out if you're reaching new people or just delighting your current audience.
Ready to break free from the 90-day data limit and see the full story behind your performance? Repostly offers unified analytics, automated reports, and unlimited historical data to help you build a smarter strategy. See what your data is really telling you by starting your free trial today.
Keep reading

10 Fresh Instagram Story Idea Tactics for 2025
Stuck for content? Discover our top Instagram story idea list, with actionable tips to boost engagement and grow your audience in 2025.

A Practical Social Media Planner for German Markets
Build a results-driven social media planner for Germany. This guide offers actionable strategies for content, scheduling, and analysis in the German market.

Crafting Your Social Media Content Plan
Stop guessing and start strategizing. This guide provides an actionable social media content plan to audit, plan, and execute content that gets results.
Post once. Show up everywhere.
Start your 7-day free trial and publish your next video to every platform in minutes.Pick a plan and publish your next video to every platform in minutes.
Start your free trialSee plansCancel anytime