kpis of social media: Mastering Metrics for Growth
Discover kpis of social media and how to measure, analyze, and optimize performance to drive sustainable growth.
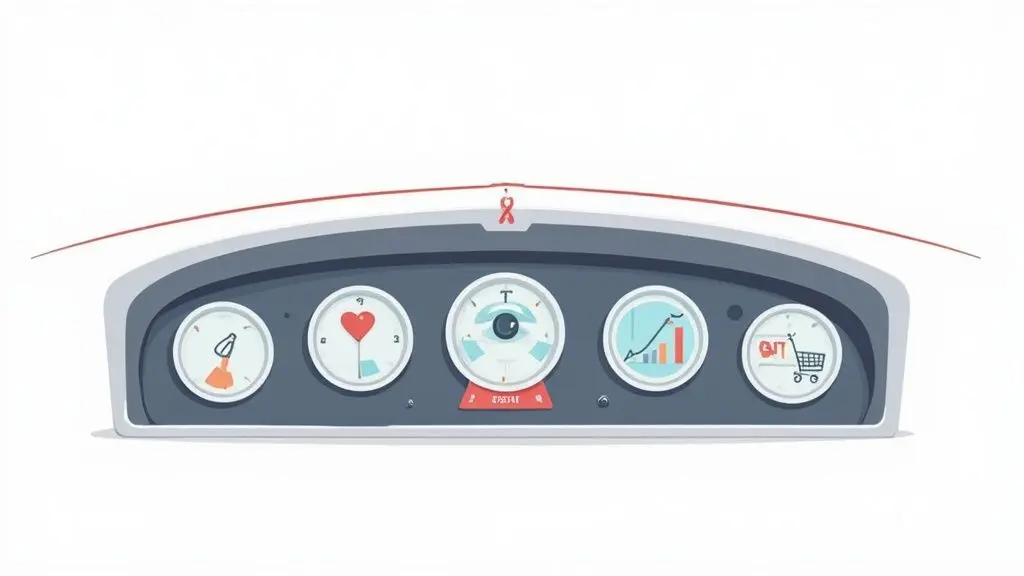
When we talk about Key Performance Indicators (KPIs) for social media, we're really talking about the specific, measurable numbers that show you if your efforts are actually working. It's about moving past simple metrics like follower counts and tying your social media activity directly to real business goals, like bringing in new leads or making sure more people know who you are.
Understanding Your Social Media Dashboard
Imagine trying to drive a car without a dashboard. You wouldn't know your speed, how much fuel you have left, or if the engine is overheating. That's what running social media without KPIs is like. You're essentially driving blind.
Your KPIs are that dashboard. They give you the crucial feedback needed to guide your strategy and make sure you're heading towards your business destination.
Too many brands get caught up in vanity metrics—things like page likes or total followers. Sure, big numbers look impressive, but they don't mean much on their own. What's the point of having 100,000 followers if none of them are interacting with your posts or buying your products? The real goal is to shift from chasing popularity to driving performance.
The Four Pillars of Social Media KPIs
To get a clear, complete picture of your performance, it helps to group your social media KPIs into four main categories. Each one represents a different part of the customer's journey with your brand, from the first time they hear about you to the moment they start telling their friends.
Before we dive into the specific metrics for each category, this table offers a quick snapshot of the four pillars and what they're all about.
| KPI Category | Primary Goal | Example Metrics |
|---|---|---|
| Awareness | Measuring how far and wide your content is spreading. | Reach, Impressions, Audience Growth Rate |
| Engagement | Tracking how people are interacting with your posts. | Likes, Comments, Shares, Engagement Rate |
| Conversion | Showing if your social media is driving action. | Click-Through Rate (CTR), Leads, Sales |
| Advocacy | Gauging customer loyalty and word-of-mouth. | Customer Mentions, Brand Sentiment, Reviews |
This framework helps you see the bigger picture and connect your day-to-day social media tasks to meaningful business results.
This diagram really brings the concept to life, showing how Awareness and Engagement act as the foundation for everything else you want to achieve.
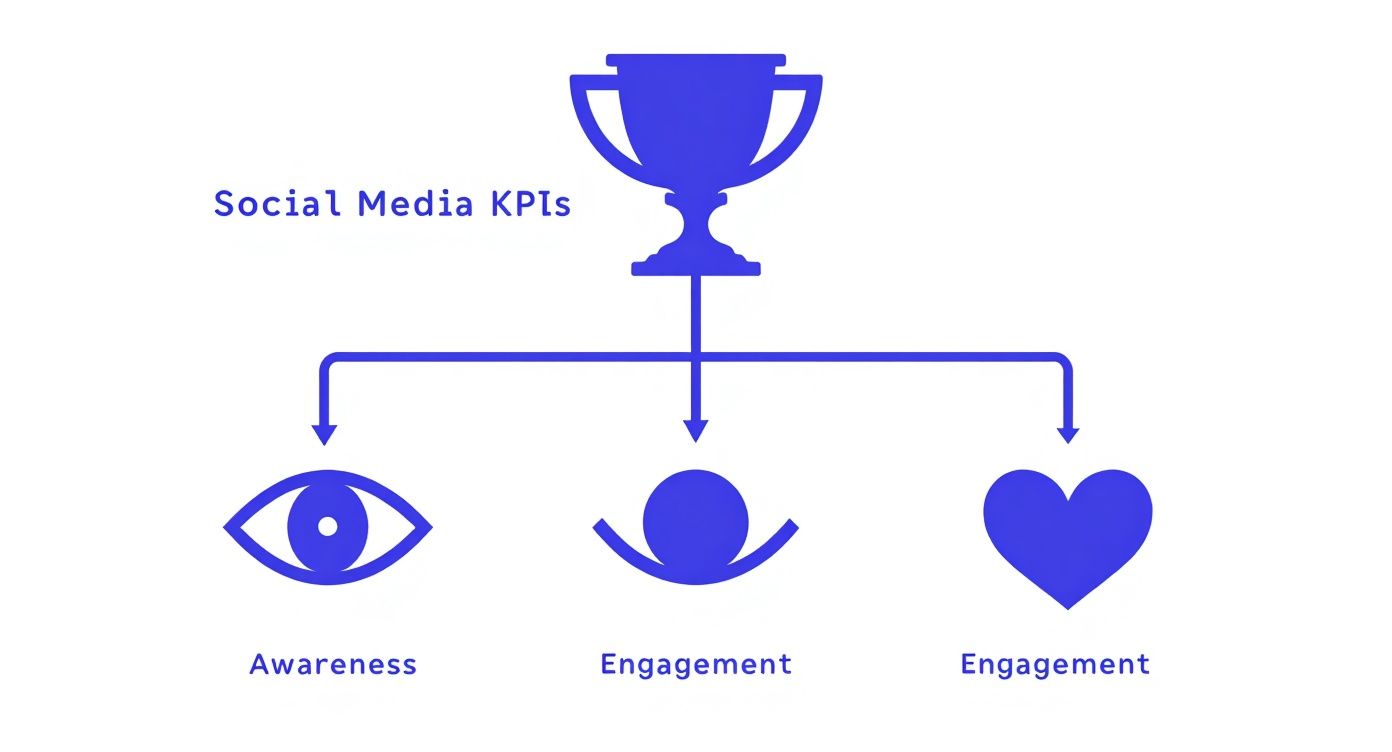
As the visual shows, you can't get to conversions or build a loyal following without first getting people's attention (Awareness) and then getting them to interact with you (Engagement). It’s a logical progression.
By aligning your social media activities with these four pillars, you transform your social presence from a simple broadcast channel into a powerful engine for business growth. It ensures every post, campaign, and interaction has a clear purpose tied to a measurable outcome.
For more in-depth advice on social media strategy and creating great content, you can often find helpful articles on resources like theclipbot's blog. Now, let’s break down the specific KPIs you should be tracking within each of these four core categories, starting with Awareness.
Gauging Your Brand's Awareness and Reach
Think of your social media efforts like a radio broadcast. The very first question you have to ask is a simple one: is anyone actually listening? This is precisely what awareness and reach KPIs are for. They tell you just how big your potential audience is and how far your content is travelling across different platforms.
These metrics are the bedrock of your entire social media plan. Before you can even think about getting likes, comments, or sales, you need to grab people's attention. Keeping a close eye on your awareness KPIs shows you the size of your digital footprint and whether you're managing to cut through all the online chatter.
The Key Metrics for Awareness and Reach
To get a true sense of your brand's visibility, you need to focus on a few essential numbers. Each one gives you a different piece of the puzzle, helping you understand not just how many people see your content, but how they're seeing it.
- Impressions: This is the total number of times your content popped up on a screen. If one person sees your post three times, that's three impressions. Think of it purely as exposure.
- Reach: This, on the other hand, is the number of unique people who saw your content. In that same example where one person saw your post three times, your reach is just one. This KPI is vital for understanding the true size of your audience.
- Audience Growth Rate: This metric simply tracks how quickly you're gaining new followers. You calculate it by dividing your new followers by your total followers over a set period, which gives you a percentage showing your growth momentum.
The easiest way to remember the difference between Impressions and Reach is to think of a billboard on a busy road. Impressions are the total number of times cars drove past it, while Reach is the number of individual drivers who saw it. High impressions with low reach could mean a small, loyal group sees your content over and over, whereas high reach suggests you're successfully breaking into new audiences.
Making Sense of the Numbers in a Shifting Market
Understanding your reach isn't as simple as looking at a single number and calling it a day. The social media world is constantly in flux, and platform dynamics can make your numbers swing wildly. That’s why consistent tracking is so important. For a much deeper dive into how reach works and why it’s so critical, check out our guide on what social media reach is and how you can boost it.
Germany's social media market is a perfect real-world example of this volatility. While there were 65.5 million social media user identities in early 2025—that's 77.6% of the population—the numbers on specific platforms can change in the blink of an eye. For instance, Meta reported that Facebook's ad audience in Germany dropped by 1.25 million (4.9%) in just three months between late 2024 and early 2025.
This kind of shift shows just how much things like seasonal trends, sudden algorithm updates, or even simple user boredom can affect your visibility. It's a stark reminder of why regularly tracking these kpis of social media isn't just a good idea—it's absolutely essential for running effective campaigns. You can explore more stats on the dynamic German digital market on DataReportal.com.
Analysing Your Audience Engagement
If reach tells you how many people you're speaking to, engagement tells you who's actually leaning in to listen. Think of it as the pulse of your social media presence. It’s the active, tangible way your audience interacts with your content, and it’s a clear sign that your message isn’t just being seen—it’s actually landing.
These metrics go way beyond passive views to capture the real heartbeat of your community. A high engagement rate is one of the strongest signals you can get that your content strategy is connecting with the right people, in the right way.
Core Engagement Metrics You Must Track
Every platform has its own little quirks, but a handful of core engagement KPIs are universal and should form the bedrock of your measurement plan. Keeping a close eye on these helps you understand what your audience is doing.
- Likes: This is the quickest, simplest form of feedback. While some might dismiss them as a vanity metric, a steady stream of likes shows your content's general tone and style are on the right track.
- Comments: Now we're talking. A comment is a much stronger signal because it shows your content was compelling enough to make someone stop, think, and type out a response. This is where community building begins.
- Shares (or Reposts): This is the ultimate social media compliment. When someone shares your post, they're essentially vouching for it to their own circle of friends and followers. They're becoming a brand advocate for you.
- Clicks: This metric is all about intent. Whether it’s a click on a link, a tap to view your profile, or an expansion to read more, it shows a clear desire to learn more about what you have to offer.
A post with many likes is good, but a post with many shares is gold. Likes show appreciation, but shares demonstrate that your audience found the content so valuable they were willing to stake their own reputation on it by passing it along.
For a deeper dive into these metrics, our guide on how to measure social media engagement is the perfect next step.
Interpreting Engagement in a Multi-Platform World
Tracking engagement gets a bit more complicated when you remember people don't live on just one platform. In Germany, for instance, the social media landscape is interesting. While Facebook has a massive 47.63% market share, the average person is juggling 5.4 different social accounts. This tells us that looking at the kpis of social media through a single-platform lens just won’t cut it.
The reality is that 95.1% of users are on their mobile devices, flicking between apps. This means our strategies have to be broader. We need to analyse how engagement looks and feels different from one platform to another, because we’re competing for a slice of someone’s very divided attention. You can explore more about German social media statistics on Statcounter.
Tracking Conversions and Proving ROI

Alright, this is where the rubber meets the road. All the likes and shares in the world don't mean much if they don't eventually lead to real business results. Tracking conversions and calculating your Return on Investment (ROI) is how you connect your social media buzz to your bottom line.
These are the kpis of social media that get the attention of decision-makers and secure your budget for next year. We're moving beyond simple engagement and asking the crucial question: "What is all this activity actually worth?"
Key Conversion and Financial KPIs
To really grasp the financial impact of your social strategy, you need to focus on the metrics that bridge the gap between a simple click and actual revenue. These KPIs tell the story of how a follower becomes a customer.
- Conversion Rate: This is the big one. It's the percentage of people who take a specific action you want—like buying a product or signing up for a webinar—after clicking a link in your post. A strong conversion rate is proof that your content isn't just nice to look at; it's persuasive.
- Click-Through Rate (CTR): Before you can get a conversion, you need a click. CTR tells you what percentage of people who saw your post were intrigued enough to click the link inside it. It’s a direct measure of how compelling your message and visuals are.
- Cost-Per-Click (CPC): If you're running paid campaigns, CPC is your efficiency metric. It shows exactly what you’re paying for every single click. The goal is always to drive this number down, getting more potential customers to your site for less money.
Think of it like a shop on the high street. Your CTR is the number of people who look at your window display and decide to walk inside. Your Conversion Rate is the percentage of those people who actually pull out their wallets and buy something. You need both to be working well.
From Clicks to Cash: Proving Your Worth
Beyond tracking individual actions, you need to tie it all back to money. Return on Ad Spend (ROAS) is a non-negotiable KPI for any paid social campaign. It's a simple calculation: divide the revenue your ads generated by what you spent to run them.
If you achieve a ROAS of 4:1, it means you're making €4 for every €1 you put in. That's a language every executive understands. For brands running paid ads, mastering Facebook Ads conversion tracking is absolutely essential to prove your campaigns are pulling their weight.
Getting this data right depends on solid technical setup. Tools like UTM parameters (which add tracking codes to your URLs) and platform-specific pixels (like the Meta Pixel) are what allow you to follow a user's journey from a social media post to a completed purchase on your website.
To get a complete picture of connecting these dots, our detailed guide on how to measure social media ROI is a great next step.
This is more important than ever, especially in the German market. Projections show that by 2025, over 80% of the population—that's more than 67.8 million people—will be active on social media. This massive, mobile-first audience means that a sharp focus on conversion rates and ROAS is the only way to truly measure the impact of your campaigns.
Evaluating Customer Loyalty and Advocacy

While getting a conversion feels like a win, it’s really just the beginning. The real goal is to turn that one-time buyer into a genuine, lifelong fan of your brand. Social media isn't just a sales channel; it's the perfect place to build and nurture these long-term relationships.
This final pillar of social media KPIs helps you measure the health of your brand community and its power to grow organically through word-of-mouth. Think of it like this: conversion KPIs track the success of a single transaction, but loyalty and advocacy KPIs reveal the strength of the entire relationship. These are the metrics that show you who is not just buying from you, but actively cheering you on.
Key Metrics for Loyalty and Advocacy
To truly understand loyalty, you need to look beyond your own posts and listen to what the community is saying about you. These indicators give you a direct line into customer satisfaction and overall brand health.
Customer Testimonials and Reviews: This is raw, unfiltered feedback shared right on social platforms. Keeping an eye on the volume and tone of reviews on Facebook, or even in your comment sections, gives you a clear pulse on how happy your customers are.
User-Generated Content (UGC): There's no stronger endorsement than when a customer loves your product so much they create their own content about it. This could be an unboxing video, a photo of them using your product, or a detailed review. Tracking mentions and branded hashtags is the best way to uncover this goldmine of content.
Social Sentiment: This is the overall vibe of the conversation around your brand. Is it positive, negative, or neutral? Tools can analyse mentions to give you a sentiment score, which basically acts as an early warning system for any potential reputation issues.
Tracking advocacy is like measuring the ripples after you’ve thrown a stone in a pond. The initial splash is the sale, but the ripples—the shares, the positive mentions, the user-generated content—show the true, lasting impact of your brand on the community.
Quantifying Brand Loyalty
While sentiment gives you a qualitative feel for things, the Net Promoter Score (NPS) provides a more concrete number to measure loyalty. It’s traditionally an email survey metric, but you can easily adapt it for social media by running polls or sharing a survey link with your followers.
NPS boils down to one simple question: "On a scale of 0-10, how likely are you to recommend our brand to a friend?"
Based on their answers, customers fall into three camps:
- Promoters (score 9-10): These are your die-hard fans. They are your most enthusiastic and loyal customers who will sing your praises.
- Passives (score 7-8): They're satisfied with your product but aren't necessarily enthusiastic advocates. They're vulnerable to being wooed by competitors.
- Detractors (score 0-6): These are unhappy customers who could potentially damage your brand's reputation through negative word-of-mouth.
By calculating your NPS, you get a single, powerful score that reflects your overall customer loyalty. A high score is a fantastic sign of a healthy, growing community of advocates who will help fuel your brand’s organic growth for years to come.
Building Your Custom KPI Dashboard
Knowing your social media KPIs is one thing. Actually tracking them in a way that makes sense is a completely different ball game. This is where a custom KPI dashboard comes in – it’s your command centre, pulling all those scattered data points together into a clear, visual story of what’s working and what isn’t. A good dashboard stops you from just collecting numbers and helps you start making smarter decisions.
Before you even think about tools, you have to get clear on your goals. You wouldn't use the same dashboard for a fighter jet as you would for a family car, right? The same logic applies here. The KPIs you’ll obsess over for a brand awareness campaign will look wildly different from those for a direct lead generation push.
Selecting Your Tools and KPIs
Once you know what you’re measuring, you can pick your tools. This is a crucial step, and you've got a few solid options, each with its own pros and cons.
- Native Platform Analytics: Think Meta Business Suite or TikTok Analytics. These are free, built-in tools that give you a treasure trove of data straight from the source. They're perfect when you need to do a deep dive into how you're performing on a single platform.
- Third-Party Solutions: Tools like Hootsuite or a social media management platform like Repostly are fantastic for pulling everything together. They gather data from all your different social networks into one place, giving you a holistic view and making it easy to compare performance across channels.
- Data Visualisation Tools: If you need total control and customisation, something like Google Data Studio (now Looker Studio) or Tableau is the way to go. These let you import data from virtually anywhere and build reports from scratch that are perfectly tailored to what your boss or your clients want to see.
For example, here’s a peek at a typical interface in Google Analytics. This is ground zero for tracking how much traffic your social media campaigns are actually driving to your website.
This view lets you see precisely which social channels are sending you the most engaged visitors – a critical KPI when your goal is conversion.
Your dashboard should tell a story at a glance. If someone has to ask you what a chart means, it’s too complicated. Clarity beats complexity every single time. The whole point is to instantly see your wins and spot any red flags that need your attention.
At the end of the day, a well-built dashboard is so much more than a reporting tool. It's a strategic compass. It helps you spot trends as they happen, fine-tune your content on the fly, and prove, with hard numbers, the real value your work on social media brings to the business.
Answering Your Social Media KPI Questions
Diving into social media measurement can feel like you're learning a new language. Let's clear up some of the most common questions so you can start applying these ideas with confidence.
Which KPIs Are Most Important For A New Business?
If you're just starting out, your main goal isn't sales—it's getting noticed. That’s why you should focus squarely on Awareness and Engagement KPIs first. Before anyone can buy from you, they need to know you exist and see that your content resonates.
Look closely at metrics like Audience Growth Rate, Reach, and Engagement Rate. These numbers are your foundation. They tell you if you're building a real presence and a community that cares, which are the first crucial steps towards hitting bigger business targets.
What’s the difference between a metric and a KPI? It’s a common question. Think of it like this: a 'metric' is just a number you can count, like how many likes a post gets. A 'KPI' (Key Performance Indicator) is a metric you've hand-picked because it directly measures how you're doing against a specific business goal. So, all KPIs are metrics, but only the most vital metrics earn the title of KPI.
How Often Should I Report On My Social Media KPIs?
There's no single magic number here; your reporting rhythm should match your goals. What matters most is consistency. A good approach is to think in layers:
- Weekly Check-ins: Perfect for the fast-moving stuff. Keep an eye on tactical metrics like Engagement Rate and Click-Through Rate (CTR) to see how your current campaigns are performing and make quick adjustments.
- Monthly Reports: This is where you zoom out a bit. Use this time for a more strategic look at trends in things like Audience Growth and overall conversions.
- Quarterly Reviews: Time for the big picture. This is when you step back to see how your social media efforts are lining up with major business objectives and decide if your long-term strategy needs a rethink.
This tiered system helps you stay on top of the day-to-day details without ever losing sight of your ultimate destination. It ensures the kpis of social media you're tracking are truly guiding your decisions, not just creating noise.
Ready to take control of your social media performance? With Repostly, you can track all your essential KPIs from every platform in one simple, unified dashboard. Get the clear insights you need to grow faster. Start optimising your strategy today at https://repostly.app.
Keep reading

10 Fresh Instagram Story Idea Tactics for 2025
Stuck for content? Discover our top Instagram story idea list, with actionable tips to boost engagement and grow your audience in 2025.

A Practical Social Media Planner for German Markets
Build a results-driven social media planner for Germany. This guide offers actionable strategies for content, scheduling, and analysis in the German market.

Crafting Your Social Media Content Plan
Stop guessing and start strategizing. This guide provides an actionable social media content plan to audit, plan, and execute content that gets results.
Post once. Show up everywhere.
Start your 7-day free trial and publish your next video to every platform in minutes.Pick a plan and publish your next video to every platform in minutes.
Start your free trialSee plansCancel anytime