Mastering Your Social Media Analytics Dashboard
Transform your social media strategy with this guide to using a social media analytics dashboard. Learn to interpret data, track key metrics, and drive growth.

Think of your social media analytics dashboard as the command center for your entire online presence. It’s where all the confusing data from your different channels—the likes, shares, and clicks—comes together to tell a clear story about what’s actually working. It's less like a spreadsheet and more like the cockpit of an airplane, giving you all the vital signs in one place so you can make smart, confident decisions.
What Is a Social Media Analytics Dashboard
Imagine trying to drive through a new city without a map or GPS. You’d probably get lost, frustrated, and waste a ton of time. That's what running social media without a proper analytics dashboard feels like. It’s your strategic map, guiding every post, campaign, and interaction.
Instead of the soul-crushing task of logging into each platform, exporting CSV files, and trying to mash them all together, a dashboard does the heavy lifting for you. It automatically pulls in all that information in real-time and displays it with clean charts and graphs you can understand at a glance. This lets you see what’s resonating and what’s falling flat, right now.
From Raw Data to Strategic Clarity
The real magic of a social media analytics dashboard is how it turns a sea of raw numbers into insights you can actually use. It helps you get to the "why" behind your metrics. You won't just know that a post did well; you'll start seeing why—was it the timing, the video format, or the question you asked?
This kind of clarity is the foundation for real growth. It lets you:
- Find Your Winning Content: See exactly which topics, images, and messaging styles make your audience stop scrolling.
- Sharpen Your Campaigns: Monitor campaign results as they happen, so you can tweak your strategy on the fly instead of waiting until it's too late.
- Get to Know Your Audience: Discover when your followers are online and what truly motivates them to comment, share, or click.
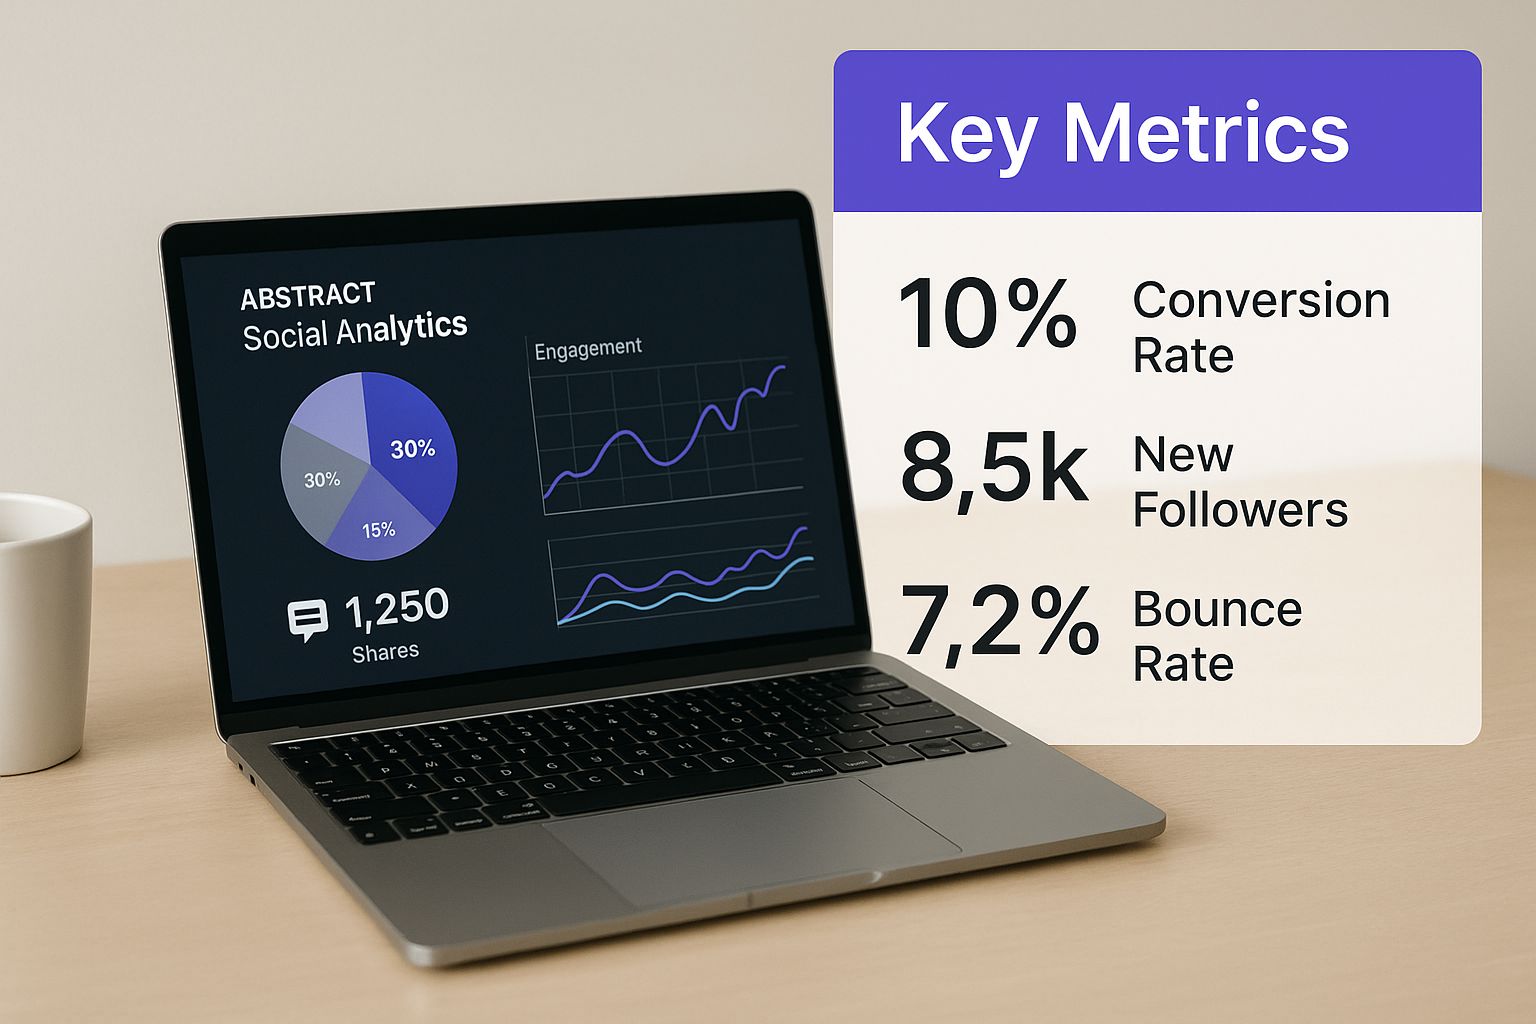
Here’s a look at what a typical dashboard provides, showing key performance indicators in a simple, visual format.
The charts make it easy to see things like engagement rates, audience growth, and your best-performing posts, all in one snapshot.
A dashboard moves you from guessing what your audience wants to knowing what they respond to. It’s the difference between reactive posting and proactive strategy building.
It's no surprise that businesses are catching on. The global market for social media analytics was valued at a whopping USD 14.0 billion in 2024 and is expected to skyrocket to USD 83.11 billion by 2033, according to research from IMARC Group. This explosive growth is all driven by the need to build smarter, customer-focused strategies.
Choosing the right platform is a big first step. Our guide on the best social media analytics tools can help you find the perfect fit for your needs.
The Essential Metrics Every Dashboard Should Track
A great social media dashboard is all about tracking the right numbers. It’s easy to get fixated on vanity metrics like follower counts, but the real magic happens when you focus on data that actually tells you how your business is doing. To get the full story, you need to look at four core areas.
Think of it like checking your car's vitals. You wouldn't just stare at the speedometer, right? You'd also keep an eye on the fuel gauge, engine temperature, and oil pressure. Each one gives you a critical piece of information. Ignore one, and you could be heading for trouble.
This is how the key metrics work together to build a strong social media presence, from getting seen to making an impact.
As you can see, it's a layered approach—each set of metrics builds on the last, leading from basic visibility all the way to real business results.
Engagement Metrics: The Heartbeat of Your Community
Engagement metrics are your direct line to understanding if you’re truly connecting with people. These numbers show that your audience isn't just scrolling past—they’re actually stopping to interact. It’s the difference between talking at people and talking with them.
Here's what to watch:
- Likes and Reactions: These are your quickest pulse check. They tell you, at a glance, if a piece of content hit the mark.
- Comments: A comment is a much stronger signal. It means you’ve said something that sparked a thought or an emotion strong enough for someone to type out a reply.
- Shares and Retweets: This is gold. When someone shares your post, they're vouching for your brand in front of their own friends and followers. It’s a powerful, organic endorsement.
- Saves: On platforms like Instagram, saves are huge. They show your content is so valuable that people want to keep it and come back to it later.
Reach and Impressions: Gauging Your Visibility
While engagement shows the depth of your connection, reach and impressions tell you about the breadth of your audience. In other words, how many eyeballs are you actually getting on your content?
It's easy to mix these two up, but they measure different things. Impressions count the total number of times your post was displayed on a screen. Reach, however, tells you how many unique people saw it. So, if one person sees your post five times, that’s 5 impressions but only 1 person reached.
Why track both? If you have sky-high impressions but very low reach, it might mean you're just showing your posts to the same small group over and over. That's a clear signal to switch up your targeting and find new audiences.
Audience Growth: Measuring Your Influence
Watching your follower count climb is a good sign that your brand's influence is growing. But don't just look at the total number; the follower growth rate is where the real story is.
A healthy growth rate means your content strategy is working, consistently pulling in new people who are genuinely interested in what you have to say. When you see a sudden spike in followers, dig in! It often points back to a specific post that went viral or a campaign that really landed, giving you a proven formula you can try to repeat.
Conversion Metrics: Tying Social to Business Goals
At the end of the day, your social media efforts need to help the business. Conversion metrics are the bridge that connects your social media activity directly to tangible outcomes like leads, sign-ups, and sales.
- Click-Through Rate (CTR): This is the percentage of people who saw your post and actually clicked the link. A low CTR is often a sign that your caption or call-to-action isn't compelling enough to make people take that next step.
- Conversion Rate: Of all the people who clicked, how many followed through and completed the goal—like making a purchase or downloading a guide? This is the ultimate test of whether your campaign truly worked.
Key Social Media Metrics and Their Business Impact
To pull it all together, this table breaks down the most important metrics, explaining what each one measures and how it connects to specific business objectives.
| Metric Category | Specific Metric | What It Measures | Business Goal It Informs |
|---|---|---|---|
| Engagement | Likes, Comments, Shares | How actively your audience interacts with your content. | Brand Loyalty & Community Building |
| Reach | Reach, Impressions | The total number of unique people who see your content. | Brand Awareness & Market Penetration |
| Audience | Follower Growth Rate | The speed at which you are gaining new followers. | Influence Growth & Content Strategy Validation |
| Conversion | CTR, Conversion Rate | How effectively your content drives specific user actions. | Lead Generation & Sales Revenue |
By tracking these conversion metrics in your social media analytics dashboard, you close the loop. You’re no longer just guessing—you’re proving the real, measurable value your social strategy brings to the bottom line.
Alright, you've got a handle on the metrics that actually matter. Now comes the fun part: picking the right social media analytics dashboard to track them.
Think of it less like finding the one "best" tool out there and more like finding the best tool for you. It's like buying a car. A solo consultant might just need a zippy little Smart Car to get around, but a big agency juggling a dozen clients? They're going to need a full-blown tour bus.
The options are all over the map. You can always start with the free, built-in analytics from platforms like Instagram and Facebook. They're great for a quick look, but to see everything in one place, you'll need a dedicated, third-party dashboard.
What Do You Actually Need?
Before you get dazzled by flashy features, take a hard look at your own situation. A tool built for a massive corporation will be a clunky, expensive nightmare for a small shop.
Start by asking yourself a few simple questions:
- Budget: What's a realistic monthly spend? Tools can range from free to thousands of dollars.
- Team Size: Is it just you, or do you need a tool that lets a whole team collaborate?
- Main Goal: Are you trying to build brand awareness, get more leads, or drive online sales? Your answer here will tell you which features are must-haves versus nice-to-haves.
A small ecommerce store, for example, will live and die by its sales data. They should be looking for a dashboard that’s killer at tracking conversions and calculating ROI. An agency, on the other hand, needs top-notch reporting and the ability to flip between client accounts without pulling their hair out.
Key Features to Hunt For
Once you know what you need, you can start comparing tools based on the features that will actually make a difference for your brand. A good dashboard does more than just count likes and follows.
A great dashboard doesn’t just show you what happened; it should help you understand why it happened and what you should do next.
Look for the more advanced stuff, like sentiment analysis (is the online chatter about you positive or negative?) and competitive tracking (how are you doing compared to the other guys?). Integration is also huge. Your dashboard needs to play nice with the other tools you already use, like your CRM or email platform, to give you the full story of a customer's journey.
The top players in this space are always adding new capabilities. Companies like IBM, Oracle, Hootsuite, and Sprout Social are building in some seriously cool tech, from behavior analysis to AI-driven insights. Sprout Social, for instance, is brilliant at pulling all your data from different platforms into one clean view, while IBM Watson uses AI to dig deep into how people truly feel about a brand. You can get a sense of where the industry is headed from this social media analytics market report.
Picking a tool with these kinds of forward-thinking features means you’re setting yourself up to stay ahead of the game, not just play catch-up.
Turning Dashboard Data Into Actionable Insights
The raw numbers on your social media analytics dashboard are a lot like a pile of uncooked ingredients. They have potential, sure, but you can't serve them for dinner. The real magic happens when you interpret those numbers and figure out what to do next. You have to become a data storyteller, digging into the "why" behind every metric.
Simply looking at the numbers isn't enough. You need to start asking questions. Why did that last video get triple the engagement of the one before it? What happened last Tuesday to cause that sudden drop in reach? This is how you turn a simple report card into a strategic roadmap for your next big move.
Connecting Metrics to Real-World Scenarios
Let's walk through a classic example. Your dashboard shows a recent post earned a ton of impressions, which is great, but the click-through rate (CTR) was disappointingly low. That’s not a failure—it's a clue.
What this tells you is that your visual or headline was strong enough to stop people from scrolling, but the actual message or call-to-action didn't seal the deal.
The insight is crystal clear: your hook works, but your offer doesn't. This simple realization lets you stop guessing and start testing specific changes, like tweaking your caption, clarifying what's in it for the user, or writing a stronger call-to-action.
This process of questioning the data is the key to getting better. You can learn more about how https://repostly.app/blog/data-analytics-in-social-media-68aed59844be737efa9f3cc5 shapes winning strategies.
From Diagnosis to Strategic Action
Once you get the hang of spotting these patterns, you can diagnose performance issues and build a clear plan for what to do next. Every metric tells you something important about your audience and content, pointing you toward specific, targeted actions.
High Engagement but Low Follower Growth? This tells you that your current followers love your stuff, but it’s not reaching anyone new. Your next step could be to experiment with different hashtags, team up with other accounts for a collaboration, or boost your best posts to a fresh audience.
Lots of Website Clicks but Few Conversions? Here, social media did its job—it sent people to your site. The problem is likely on your website itself. This insight tells you to investigate your landing page. Is the messaging confusing? Is the design clunky?
Spike in Negative Comments on a Specific Topic? This is direct, unfiltered feedback that a certain subject is a no-go for your audience. The action here is to rethink your content strategy and either change your approach to that topic or avoid it altogether.
This way of thinking applies to more than just social media. To see how these principles work in another context, check out these SMS marketing analytics strategies that also focus on turning data into decisive action.
By always asking "why" and connecting the dots between your data and potential solutions, your social media dashboard becomes your most powerful tool for growth.
Unlocking Growth with Advanced Analytics
Once you've got a handle on the basic metrics, your social media dashboard is ready to show you what's really going on under the hood. This is where you move beyond just counting likes and followers and start playing chess, not checkers. It’s the shift from tracking what happened to making things happen.
Think of advanced analytics as a superpower. It gives you the ability to understand not just what your audience does, but how they feel. It’s the difference between seeing a comment and truly understanding the emotion behind it.
Going Beyond Likes with Sentiment Analysis
One of the most powerful tools in any modern dashboard is sentiment analysis. Imagine having a real-time focus group for your brand, running 24/7. Instead of just tallying up comments, this feature digs into the language—the specific words, the context, even the emojis—to gauge whether the overall vibe is positive, negative, or neutral.
For example, a sudden spike in negative sentiment can be the canary in the coal mine for a brewing PR problem. It gives you a crucial head-start to jump on customer complaints before they spiral out of control. On the flip side, seeing a wave of positive chatter after a product launch is solid proof that your message landed perfectly.
Sentiment analysis turns raw feedback into a clear emotional barometer for your brand's health. It tells you the feeling behind the numbers, which is often more important than the numbers themselves.
This kind of insight is becoming non-negotiable. By 2025, over 5.24 billion people will be on social media, creating a firehose of data every single day. Platforms like TikTok, with its super-high interaction rate of 2.50%, produce complex signals that simple text analysis can't catch. That’s why dashboards are getting smarter, using sophisticated video and image analysis to get a complete picture. You can learn more about how the industry is adapting by checking out the latest social media analytics market reports.
Uncovering Opportunities with Competitive Benchmarking
Another game-changing feature is competitive benchmarking. This lets you measure your performance directly against your rivals, all inside your dashboard. No more guessing how you stack up. Now you can see real data on their engagement rates, audience growth, and which of their posts are hitting home.
This kind of side-by-side analysis reveals two critical things: their strengths and your opportunities.
- Is a competitor crushing it with short-form video? That's a clear sign you need to step up your own video game.
- Does their engagement tank on weekends? That might be your opening to capture an underserved audience with a perfectly timed weekend campaign.
It essentially turns their public activity into your private playbook.
Common Dashboard Mistakes and How to Avoid Them
Even with the best social media analytics dashboard at your fingertips, it's surprisingly easy to get led down the wrong path. We've all been there. You fall into a few common traps, and suddenly your strategy is built on shaky ground, wasting time on things that don't actually move the needle.
One of the biggest culprits? Chasing vanity metrics. Sure, watching your follower count climb is exciting, but what does it really mean if those followers aren't interacting with your posts or clicking through to your site? It’s like throwing a huge party where no one talks to each other. The room is full, but there's no real connection.
Instead of obsessing over follower numbers, shift your focus to metrics that actually impact your business goals. Think click-through rates, website conversions, and lead generation. These are the numbers that tell you if your social media efforts are paying the bills.
Misinterpreting Data Without Context
Another classic mistake is looking at numbers in a vacuum. You see a sudden spike in engagement and get excited—but do you know why it happened? Was it that amazing new product video, or was it a controversial post that drew a lot of negative comments? Without context, the number itself is just noise.
This is where you have to play detective. Always line up your dashboard data with what was actually happening at the time. Check your content calendar. Did you launch a new campaign? Did a major news story break? Understanding the "why" behind the data is how you learn to repeat your wins and dodge future mistakes.
- The Fix for Vanity Metrics: Make a rule: every KPI you track must connect directly to a business objective. If you can't draw a clear line from the metric to your bottom line, demote it.
- The Fix for Lack of Context: Never look at a report without also looking at your marketing calendar. What ads were running? What emails went out? The whole picture matters.
- The Fix for Analysis Paralysis: Don't try to track everything at once. Set simple, specific goals for each report and only look at the data that measures progress toward them. This keeps you from drowning in numbers.
By steering clear of these common pitfalls, your dashboard stops being a simple number-cruncher and becomes a genuine strategic partner. If you need more help picking the right data points, our guide on key social media metrics and reporting is a great place to start.
Got Questions? We’ve Got Answers.
Jumping into social media analytics can feel like learning a new language. You're bound to have a few questions. Let’s clear up some of the most common ones people ask when getting started with an analytics dashboard.
How Much Should I Expect to Pay for a Dashboard?
The price tag on these tools can really run the gamut. If you're just dipping your toes in the water, the built-in analytics on platforms like Instagram and Facebook are a great starting point, and they're completely free. They give you a solid, if basic, look at how you're doing on that one channel.
When you're ready for a more complete picture, a third-party dashboard is your next step.
- For small businesses or creators: You can find great options in the $25 to $100 per month range. These tools pull all your accounts into one place and track the most important metrics.
- For large agencies or enterprises: The sky's the limit, with some platforms costing thousands each month. These enterprise-level solutions come loaded with sophisticated features like AI-powered sentiment analysis and deep dives into what your competitors are up to.
Is It a Pain to Set Up a Dashboard?
Not at all. Getting a new dashboard up and running is usually surprisingly painless. The first part—connecting your social media accounts—takes just a few minutes. You simply authorize the tool, and it starts pulling in your data automatically.
Where you'll spend a little more time is in the customization. This is the fun part, where you tell the dashboard what's most important to your brand. Setting up reports to track your specific Key Performance Indicators (KPIs) and exploring the more advanced features might take an hour or two, but it’s time well spent. Most modern tools are built to be intuitive, walking you through the process.
The initial hookup is quick. The real magic happens when you invest a little time customizing the dashboard to reflect what success actually means to you.
Can a Dashboard Really Help My Social Media ROI?
Without a doubt. A good dashboard's main purpose is to take the guesswork out of your strategy. It gives you hard data, showing you exactly which posts are leading to real business results—like clicks to your website, new sign-ups, or sales—and which ones are just shouting into the void.
When you know what works, you can put more energy and budget into those successful tactics and stop wasting time on things that aren't moving the needle. This laser-focused approach is how you directly improve your Return on Investment (ROI), making sure every bit of effort is spent wisely.
Ready to stop guessing and start growing? Repostly provides a unified social media analytics dashboard that turns your data into a clear roadmap for success. Start your free 7-day trial of Repostly today and see how easy it is to make smarter, data-driven decisions.
Keep reading

10 Fresh Instagram Story Idea Tactics for 2025
Stuck for content? Discover our top Instagram story idea list, with actionable tips to boost engagement and grow your audience in 2025.

A Practical Social Media Planner for German Markets
Build a results-driven social media planner for Germany. This guide offers actionable strategies for content, scheduling, and analysis in the German market.
Crafting Your Social Media Content Plan
Stop guessing and start strategizing. This guide provides an actionable social media content plan to audit, plan, and execute content that gets results.
Post once. Show up everywhere.
Start your 7-day free trial and publish your next video to every platform in minutes.Pick a plan and publish your next video to every platform in minutes.
Start your free trialSee plansCancel anytime