Mastering Social Media Analytics Reports
Go beyond numbers. Learn to create insightful social media analytics reports that prove ROI, guide strategy, and drive real business growth. Start today.

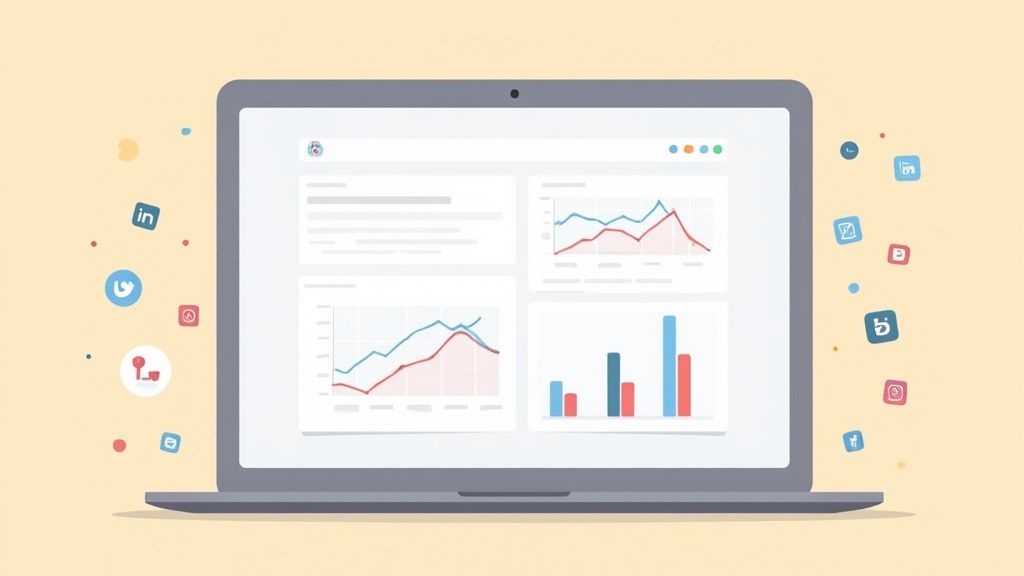
A social media analytics report does more than just list numbers from your social channels. It’s a carefully crafted document that pulls together data from all your networks to measure how you’re performing against your actual business goals. It's about turning raw figures—likes, shares, follower counts—into genuine insights that shape your strategy, prove your return on investment, and show you exactly how your audience behaves.
Think of it as your main tool for figuring out what’s hitting the mark and what’s falling flat.
Moving Beyond Metrics to Meaningful Insights
Let's be real for a moment. A report stuffed with colourful charts and impressive-looking numbers is completely useless if it doesn't give you clear next steps. The whole point is to get past the surface-level "vanity metrics" and transform that data into a practical roadmap for your brand. When done right, your analytics report tells the story behind your performance.
This guide is designed to help you cut through the noise of data overload and finally connect your social media activity to real business results. We'll show you exactly how to build reports that not only justify your budget but also drive smart, confident decisions.
Why Analytics Reports Matter Now More Than Ever
The reliance on data-driven decision-making isn't just a trend; it's becoming standard practice. In Europe, with Germany playing a significant role, the social media analytics market is expected to more than double, growing from USD 3.66 billion in 2025 to roughly USD 7.31 billion by 2030. This incredible growth shows just how seriously businesses are investing in these tools to understand their customers and track behaviour on platforms like TikTok and Instagram.
What does this mean for you? It means your reports need to be sharper and more insightful than ever if you want to stay ahead of the competition.
The Storytelling Power of Data
Your report isn't just a collection of stats; it's a narrative about your brand's journey online. Every single metric is a chapter in a larger story about your audience and how they engage with you.
- Engagement Rate: This tells you if your content is actually interesting. A sudden spike could mean that new content style you tried is really connecting with people.
- Reach and Impressions: This part of the story shows how far your message is spreading and who's laying eyes on it. It’s your brand awareness pulse check.
- Click-Through Rate (CTR): This is where the rubber meets the road. This metric shows if your call-to-action is working, directly linking your social posts to website visits or new leads.
For instance, the image below perfectly captures the cyclical nature of social media analytics—it's a constant flow from gathering data to finding insights that you can act on.
This process highlights that effective reporting isn't a one-off task. It's a continuous loop of learning and tweaking that sharpens your strategy over time. To dive deeper into which numbers matter most, check out our guide on essential social media metrics and reporting.
Defining Your Reporting Goals and KPIs
Before you even think about pulling a single piece of data, you need to know why you're doing it. A social media analytics report without a clear purpose is just a bunch of numbers. It’s your strategic goals that turn that data into a roadmap for making smarter decisions. If you skip this step, you’ll end up tracking metrics that look great on paper but do absolutely nothing for your business.
It all starts with tying your social media objectives back to the company's bigger picture. Are you trying to get more people to the website? Increase online sales? Or is it about building a rock-solid community around your brand? Each of these goals needs a totally different yardstick to measure success.
Connecting Social Goals to Business Outcomes
Think of it this way: the business objective is the destination, and your social media goals are the turn-by-turn directions to get there. This connection is what makes your social media analytics reports so valuable. If you're having a tough time proving the worth of your social media efforts, this is usually the piece you're missing.
Here’s how it looks in practice:
- Business Goal: Increase Revenue. Your social media goal might be to generate more high-quality leads from a LinkedIn campaign or to drive sales directly through Instagram Shopping.
- Business Goal: Improve Customer Retention. On social media, this could mean cutting down your customer support response times on X (formerly Twitter) or fostering a loyal community in a private Facebook group.
- Business Goal: Enhance Brand Awareness. For this, your social media goal is to get your brand name out there. You’ll want to track how much of the online conversation you own.
A great way to measure your brand's presence against competitors is to learn how to calculate Share of Voice. It's a key metric for understanding your visibility.
Choosing KPIs That Actually Matter
With your goals locked in, it's time to pick the Key Performance Indicators (KPIs) that will show you if you're on the right track. The trick is to focus on actionable metrics, not vanity metrics. A spike in likes is nice, but a metric like Click-Through Rate (CTR) actually tells you if your content is interesting enough to make someone act.
One of the biggest mistakes I see is people treating all social platforms as if they're the same. High engagement on a TikTok video has a different value than a high number of link clicks from a LinkedIn article. Always match your KPIs to the platform and its audience.
For instance, a B2B software company trying to generate leads will care about completely different KPIs than a fashion brand that’s all about building a community.
| Objective | Platform Example | Primary KPIs to Track |
|---|---|---|
| Lead Generation | Clicks, Conversion Rate, Cost Per Lead (CPL) | |
| Brand Awareness | Reach, Impressions, Follower Growth Rate | |
| Community Building | Facebook Group | Active Members, Engagement Rate, User-Generated Content |
| Customer Service | X (Twitter) | Response Time, Resolution Rate, Sentiment Score |
In the end, what you want is a focused dashboard of KPIs that tells a clear story. This careful selection process ensures your social media analytics reports are sharp, relevant, and tied directly to what really counts: growing the business. To get a better handle on how to connect these numbers to real money, check out our guide on how to measure social media ROI.
Alright, you've set your goals and picked your KPIs. Now for the part that often feels like wrestling with a hydra: actually gathering all that social media data. If you’re not careful, you can quickly find yourself buried in a mountain of spreadsheets from a dozen different platforms.
The real aim here isn't just to download a bunch of numbers. It's about creating a single, reliable source of truth. This unified view is what lets you see the forest for the trees, preventing you from getting lost in the granular, often conflicting, metrics of each individual network.
Bringing All Your Data Under One Roof
First things first, you have to pull your data from all the different places it lives—Meta Business Suite, X Analytics, LinkedIn’s reporting dashboards, you name it. Each one has its own way of presenting information, which makes comparing them a real headache. That’s why setting up a central hub isn't just a nice-to-have; it's essential for building a useful report.
You've got two main paths you can take:
- The DIY Spreadsheet Method: This involves manually exporting CSV files from each platform and piecing them together in something like Google Sheets or Excel. It’s cheap, sure, but it's also incredibly time-consuming and opens the door to human error.
- The Automated Approach: Using a dedicated social media management tool that automatically pulls data from all your accounts into a single, clean dashboard. This is a massive time-saver and keeps your data consistent.
If you're leaning towards automation (and I don't blame you), it's worth checking out some of the best social media analytics tools to see which one fits your workflow and budget.
Getting Your Metrics to Speak the Same Language
One of the sneakiest pitfalls in social media reporting is that platforms don't define metrics in the same way. A "video view" on TikTok is a completely different beast from a "view" on YouTube. If you just dump these numbers into a report side-by-side, your analysis will be flawed from the start.
My Pro Tip: Create a simple "data dictionary" for your team. This is just a document that clearly states how you will define and calculate your core metrics. For example, you might decide that for all your reports, Engagement Rate = (Likes + Comments + Shares) / Impressions. This ensures everyone is on the same page and your cross-platform comparisons are actually fair.
Nailing this step gives your social media analytics reports the credibility they need.
This chart shows a common scenario: a fantastic engagement rate but disappointing results for click-throughs and follower growth.
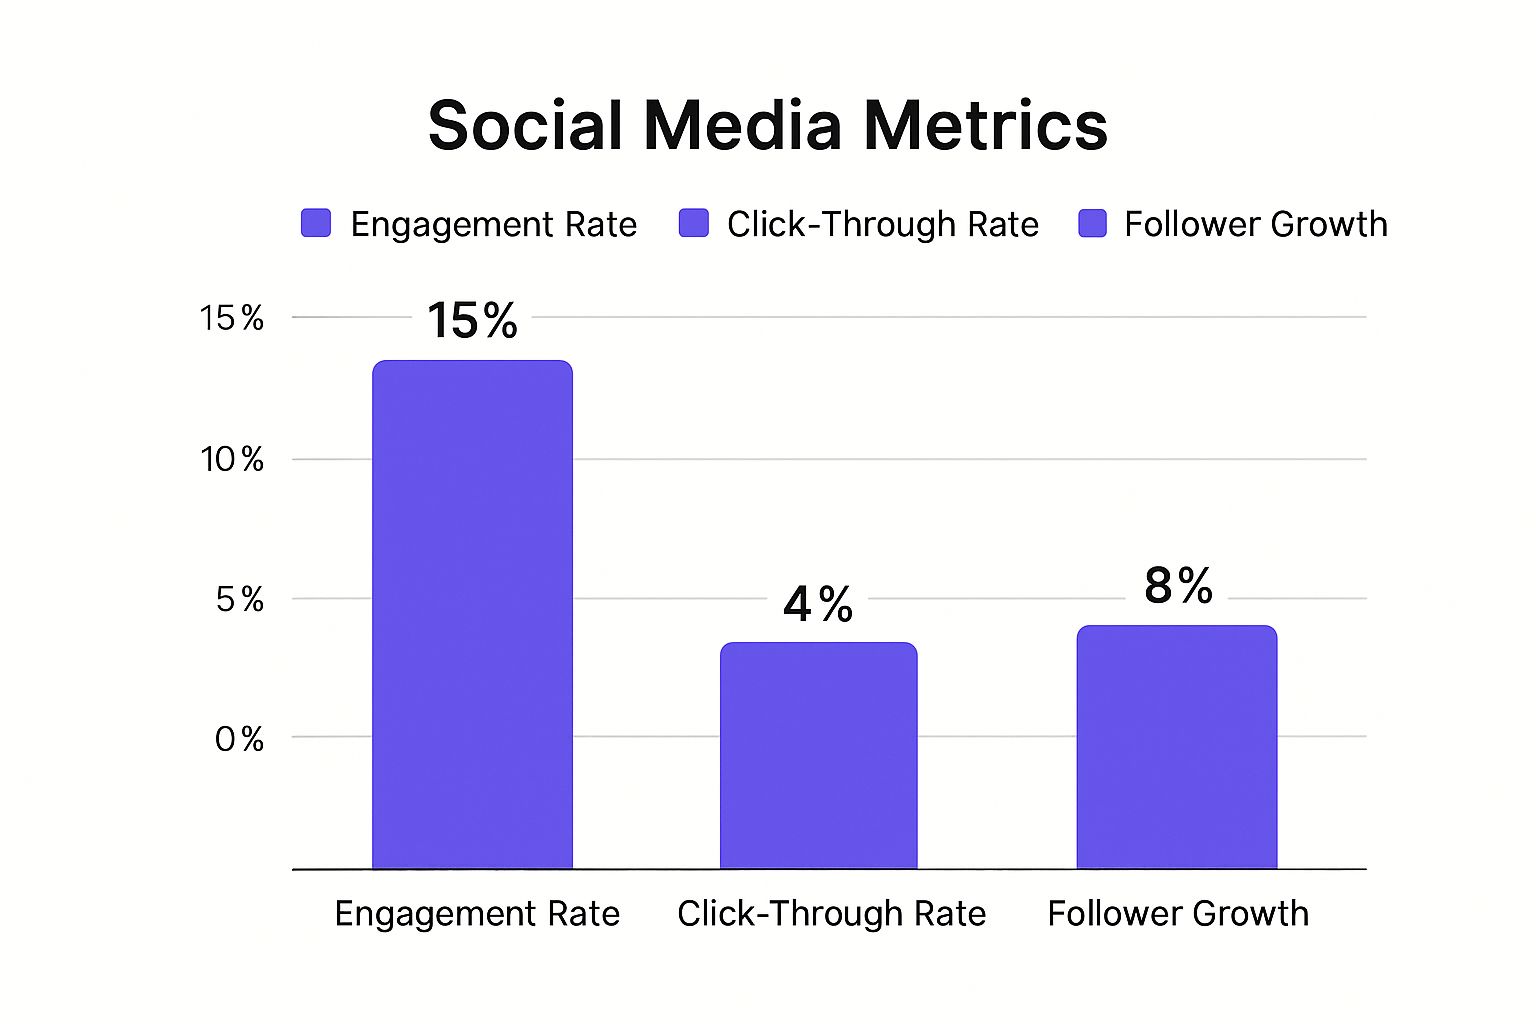
What does this tell us? The content is definitely hitting the mark with the current audience, but it's not quite doing the job of bringing new people in or pushing them to your website.
Slicing Up Your Data to Find the Real Story
With all your data collected and standardised, the fun can begin. Looking at your overall numbers is fine, but the real magic happens when you start segmenting. This is how you find the actionable insights hiding just beneath the surface.
Instead of just knowing your total engagement, segmentation helps you answer much smarter questions, like which video format drove the most leads during your last product launch.
Here are a few ways I always recommend slicing your data:
- By Campaign: Isolate all the metrics tied to a specific initiative, like a holiday sale or a new feature announcement. This is the only way to truly measure a campaign's ROI.
- By Content Format: Pit your different content types against each other. Are Instagram Reels outperforming static carousels? Do text-only posts on LinkedIn get more comments than those with images?
- By Audience Demographics: When a platform provides it, dig into how different age groups, locations, or genders respond to your content. This is pure gold for refining your targeting strategy.
- By Platform: It sounds obvious, but you need to know where your efforts are paying off. For instance, in Germany, the social scene is diverse. Facebook might hold the largest market share at around 47.6%, but the average user is active on almost seven different networks each month. Knowing this helps you decide where to invest your time and budget.
By taking the time to organise and segment your data this way, you turn a chaotic mess of numbers into a solid foundation. This is what allows you to build social media analytics reports that don't just report on the past, but actively guide your future strategy.
Turning Raw Data Into Actionable Insights
Piles of data are easy to come by. The real magic happens when you figure out what it all means. This is where you stop being a data collector and start becoming a data storyteller. Your social media analytics reports need to do more than just recap what happened last month—they should light the way for what to do next.
The whole point is to hunt for the trends, patterns, and oddities that signal either a golden opportunity or a red flag on the horizon. It’s all about shifting the conversation from "what happened?" to "why did it happen?" and, most importantly, "what are we going to do about it?"
Finding the Story in Your Numbers
Every dataset has a story buried inside it; your job is to listen closely enough to hear it.
Imagine you launched a campaign last month, and your engagement rate came in 15% lower than your usual benchmark. That’s the "what." The real insight is found when you start digging for the "why."
Was it the creative? The copy? The time of day you posted? By putting your underperforming posts side-by-side with your greatest hits, you’ll probably spot a pattern. Maybe you realise that videos featuring authentic customer testimonials consistently knock your polished, studio-shot ads out of the park. That's not just data—it’s a direct instruction for your next campaign brief.
The best insights are often found where quantitative data (the numbers) and qualitative feedback (the comments and DMs) meet. Don't just count the likes; read what people are actually saying to understand the feeling behind the figures.
This process is what turns your report from a passive document into an active strategy tool.
Connecting the Dots Across Platforms
Actionable insights rarely live in a silo. They usually pop up when you start comparing different sets of data. Don't make the mistake of analysing your channels in isolation.
Look for connections between your social media performance and other business metrics. For instance, did a big spike in Instagram Story engagement line up with a jump in website traffic from that platform? That's a clear signal to double down on interactive Story features.
Here's a real-world example. A home decor brand noticed that traffic coming from their Pinterest account had a 25% higher average order value than traffic from any other social channel.
- The Data: Pinterest is driving high-value customers.
- The Insight: The audience on Pinterest isn't just window shopping; they are actively planning purchases and have a much higher intent to buy.
- The Action: They shifted a chunk of their ad budget away from other platforms to fund targeted Promoted Pin campaigns showcasing their premium product lines.
This simple connection turned a basic traffic metric into a decision that directly boosted their bottom line.
Listening to What Your Audience is Telling You
Beyond the hard numbers, the qualitative data hiding in comments, shares, and direct messages is an absolute goldmine. This is where you uncover the "why" behind what your audience does. While sentiment analysis tools can give you a broad overview, there's no substitute for getting your hands dirty and actually reading the feedback.
You might have a post with fantastic engagement numbers, but a quick scan of the comments reveals they're overwhelmingly negative or confused. This insight is crucial. It tells you that while the topic got their attention, the execution or messaging completely missed the mark.
In a market like Germany, understanding these nuances is critical. The country is projected to have around 67.8 million active social media users by 2025, and a staggering 95.1% of them use their mobile devices to get online. This underscores just how vital it is to create mobile-first content like vertical videos and to carefully analyse how this audience engages with different formats.
From Insight to Actionable Recommendation
An insight is completely useless until you turn it into a clear, actionable recommendation. Every key finding you present should come with a suggested next step. This is what separates a truly great analyst from someone who just reports the numbers.
Here’s how that transformation works:
- Observation: "Our TikTok videos posted on Friday evenings get 40% more views on average."
- Insight: "Our target audience is most active and open to our content at the end of the work week, probably as they’re kicking back and relaxing."
- Recommendation: "Let's shift our main TikTok schedule to release one 'hero' video every Friday at 7 PM. We can use smaller posts earlier in the week to build up some buzz."
This simple framework makes sure every piece of data you present has a clear purpose. If you're looking for more ideas on how to turn data into impact, check out these actionable insights examples that drive real growth.
Ultimately, taking this approach turns your social media report from a backward-looking summary into one of the most valuable strategic tools your team has.
Designing Reports That Command Attention
Look, a brilliant analysis is only half the battle. If your insights are buried in a confusing, poorly designed document, they might as well not exist. The way you present your social media analytics can be the difference between driving real change and having your report completely ignored.
It’s all about turning that hard-won data into a compelling story people actually want to read.
The first, and most important, rule here is to know your audience. The information your C-suite needs is worlds away from what your content creation team is looking for. Blasting the same dense report to everyone is a surefire way to lose their attention from the get-go.
Tailoring Your Report for Different Stakeholders
You wouldn't use the same script for a TV commercial and a technical manual, would you? The same logic applies here. Customising your report ensures the right information gets to the right people in a format they can immediately understand and use.
- For the C-Suite: They are short on time and focused on the bottom line. Give them a high-level executive summary, zeroing in on ROI, key business outcomes, and clear strategic recommendations. Visuals are your best friend here—think simple, clean charts showing progress against major KPIs.
- For the Marketing Team: This is your core audience. They need the full story, with detailed breakdowns of campaign performance, content analysis, audience demographics, and an honest look at what worked versus what didn’t. This is where you can really get granular with the data.
- For the Sales Department: All they really care about are leads and conversions. Your job is to highlight how social media activities are filling the sales pipeline. Showcase metrics like lead quality, conversion rates from social traffic, and any customer feedback that could help them close more deals.
This tailored approach makes your report feel relevant and valuable to each person who reads it, which drastically increases the chances that your recommendations will actually be implemented.
Choosing the Right Visuals to Tell Your Story
Data visualisation isn't just about making your report look pretty; it's about making complex information understandable at a glance. The wrong chart can muddy your message, while the right one can make your key finding impossible to miss.
I’ve seen so many reports where people cram way too much information into a single chart. The goal is clarity, not complexity. Each visual should have one clear takeaway. If you find yourself having to explain a chart for more than a few seconds, it’s probably not working.
Here’s a quick guide I use to match data to the right visual:
| To Show... | Use This Chart... | Why It Works |
|---|---|---|
| Comparison over time | Line Chart | Perfect for tracking metrics like follower growth or engagement rate month-over-month. |
| Parts of a whole | Pie or Donut Chart | Ideal for showing the breakdown of your audience by platform or traffic sources. |
| Comparison between items | Bar Chart | Excellent for comparing the performance of different campaigns or content formats side-by-side. |
| Individual data points | Table | Use this when you need to show precise numbers and multiple related metrics, like in a detailed campaign summary. |
Remember, your goal is to guide the reader's eye to the most important insight immediately. A little strategic colour or a callout can do wonders to highlight key data points.
Building a Narrative That Drives Action
Finally, every great social media report follows a logical narrative. It’s not just a random collection of charts; it’s a story with a beginning, a middle, and an end that leads to a clear conclusion.
Think of it like this:
Start with the "So What?"
Kick things off with an executive summary that gets straight to the point. What were the biggest wins, losses, and key learnings from this period? Someone should be able to read just this section and understand the big picture.
Present the Evidence
This is the main body of your report where you back up your summary. I find it’s best to organise findings by goal, campaign, or platform. For each section, present your data visuals first and then briefly explain what they mean in plain English.
Provide Strategic Recommendations
This is the most crucial part. Based on your analysis, what should the team start, stop, and continue doing? You have to be specific and actionable here. Instead of saying "we should increase engagement," suggest something like, "Let's create more carousel posts on Instagram, as they drove 25% higher engagement than Reels this month."
By structuring your report this way, you transform it from a simple summary of the past into a powerful, forward-looking tool that genuinely guides future strategy and proves the value of your work.
Frequently Asked Questions

Even with the best tools, some practical questions always pop up when you're deep in the data. Let's tackle some of the most common hurdles you might face when creating your social media analytics reports.
How Often Should I Be Running These Reports?
This is a classic question, and the honest answer is: it depends on your audience and your goals. There’s no magic number, but a tiered approach usually works best.
For your day-to-day marketing team, a weekly or even bi-weekly report is invaluable. It’s the perfect cadence for spotting what’s working, what isn’t, and making agile adjustments to live campaigns. Think of it as your team's tactical check-in.
When it comes to senior management or clients, a monthly report is typically the sweet spot. It smooths out the daily noise and focuses on the bigger picture and longer-term trends. For this audience, it's about demonstrating consistent progress and business impact, not reacting to a single post's performance.
Of course, you'll also need more in-depth reports for specific milestones:
- Quarterly Reviews: To zoom out and see how you’re tracking against your larger business objectives.
- Annual Summaries: For a bird's-eye view of your year-over-year performance.
- Campaign-Specific Reports: To measure the precise success of a targeted, time-bound initiative from start to finish.
The key takeaway? Pick a schedule for each audience and stick to it. Consistency builds trust and makes your social media analytics reports a reliable source for decision-making.
What Are the Biggest Mistakes People Make?
It’s easy to fall into a few common traps. The biggest one I see is an obsession with vanity metrics. Sure, a massive follower count looks good on paper, but if those followers aren't engaging, clicking, or converting, it’s just a number. Always tie your metrics back to real-world business outcomes like website traffic, leads, or sales.
Another major pitfall is presenting data without context. A 5% engagement rate is meaningless in a vacuum. Is that an improvement from last month? How does it stack up against your top competitor? Without benchmarks and historical data, your numbers are just noise.
The "data dump" is the enemy of a good report. Your job isn't to show every single chart your analytics tool can produce. It's to find the story in the data and guide your audience to the most important insights. A focused narrative will always beat an overwhelming spreadsheet.
Lastly, a classic mistake is failing to customise the report for the audience. An executive wants the high-level summary and the bottom-line impact. Your content team, on the other hand, needs the granular details to understand which creative formats and topics are resonating. A one-size-fits-all report usually fits no one.
How Do I Actually Measure the ROI of My Social Media?
Proving the Return on Investment (ROI) of social media boils down to one thing: connecting your social activities to tangible business value. The secret is meticulous tracking. By using tools like the Meta Pixel and adding UTM parameters to every link you share, you can directly trace which sales, sign-ups, or downloads came from your social channels.
Once you have that conversion data, it’s time to do some simple maths. First, you need to assign a monetary value to each conversion. For an e-commerce business, this is easy—it’s the value of the sale. For a B2B company, you might calculate the value of a lead based on your average customer lifetime value (for example, each qualified lead could be worth €100).
With those figures, the formula is straightforward:
- Calculate Total Value: Number of conversions multiplied by their assigned monetary value.
- Calculate Total Cost: Add up all your related expenses—ad spend, tool subscriptions, team salaries, etc.
- Use the ROI Formula:
[(Total Value - Total Cost) / Total Cost] x 100
Even for less direct goals like brand awareness, you can still demonstrate value. Track metrics like your Share of Voice in the industry, shifts in audience sentiment, and referral traffic to your website. This shows how social media contributes to the overall health of the business, turning your social media analytics reports into a tool that proves your team's value.
Ready to build better social media analytics reports in a fraction of the time? Repostly unifies your data from all platforms into one intuitive dashboard, making it easy to track performance, spot trends, and prove your ROI. Start streamlining your reporting today at https://repostly.app.
Keep reading

10 Fresh Instagram Story Idea Tactics for 2025
Stuck for content? Discover our top Instagram story idea list, with actionable tips to boost engagement and grow your audience in 2025.

A Practical Social Media Planner for German Markets
Build a results-driven social media planner for Germany. This guide offers actionable strategies for content, scheduling, and analysis in the German market.

Crafting Your Social Media Content Plan
Stop guessing and start strategizing. This guide provides an actionable social media content plan to audit, plan, and execute content that gets results.
Post once. Show up everywhere.
Start your 7-day free trial and publish your next video to every platform in minutes.Pick a plan and publish your next video to every platform in minutes.
Start your free trialSee plansCancel anytime