Social Media Analytics Tools, Starting With the Free Ones in Each App
Where to find Instagram, TikTok, YouTube, Facebook and Threads analytics for free, what they can't show you, and which analytics tools fill the gaps.

The best social media analytics tool to start with is free and already on your phone. Instagram, TikTok, YouTube, Facebook and Threads each have their own analytics screen, and it’s the most detailed place to see how a post did on that app. A separate analytics tool earns its place when you post to several platforms and want one view, when someone else needs a report, or when you want to track competitors.
Below: where each app keeps its numbers, what those screens can’t do, the tools that fill the gaps, and what Repostly’s Insights show. We make Repostly.
Where each app keeps its analytics
Steps and limits come from each platform’s help pages, checked November 2026. Menus move, so the linked page has the current wording.
Instagram Insights
You don’t need a business account to see insights. Instagram’s article on viewing account and content insights says the account has to be public, personal or professional (checked November 2026). If you switch to private, you lose access; switch back within 90 days and the old data returns.
- One post or reel: in the app, go to your profile, tap the post and tap View Insights. Instagram’s post insights page lists views, interactions and profile activity, and keeps post insights for up to two years.
- The whole account: on instagram.com, select Dashboard in the left menu. With a professional account, choose Insights under For professionals; with a personal one, Your dashboard under Your insights and tools. Then pick Account or Content.
Account-level insights cover any period within the past 90 days, either the last 7, 14, 30 or 90 days or a custom range. Demographics (age, gender, top cities) only appear once you’ve reached or engaged more than 100 accounts, and Instagram’s overview of insights says follower trends need at least 100 followers.
Third-party tools are a different matter. Meta’s Instagram API for third-party apps is built for professional accounts, meaning businesses and creators (checked November 2026). Repostly reads Instagram stats through that API, so a personal account has to switch to professional before you connect it.
TikTok Analytics
TikTok’s help article on using TikTok Analytics gives the app route: tap Profile, tap the Menu ☰ button, select TikTok Studio, then Analytics (checked November 2026).
The same article says Analytics “is currently not available to everyone,” and that data can lag, so wait a few days before treating a figure as wrong.
TikTok’s Creator Academy guide to analytics (checked November 2026) adds the computer route: open TikTok Studio on the web and use the Analytics tab on the left. It lists date ranges of 7, 28, 60 or 365 days, or a custom range, and downloads of up to 365 days at a time. The Content tab ranks your top 10 posts for the period, and each video’s page shows retention and traffic sources. The Viewers and Followers tabs cover your audience; TikTok says the viewer age, gender and location figures come from predictive models rather than confirmed data.
YouTube Studio Analytics
For the channel, sign in to YouTube Studio and click Analytics in the left menu. For one video, open Content, point at the video and select Analytics. Google’s YouTube Analytics overview lists the channel-level tabs: Overview, Content, Audience, Trends and, if you’re in the YouTube Partner Program, Revenue. A single video adds Reach and Engagement tabs, with impressions, watch time and average view duration (checked November 2026). Some reports aren’t available on mobile.
YouTube also changed how it counts views this year. Google’s page on how engagement metrics are counted says that from August 24, 2026, a view counts the moment a video starts to play, in every format including Shorts (checked November 2026). Partner Program earnings still use “engaged views.” The same page warns that new videos can take a few hours to show metrics, and that verified counts can take several days to settle.
Facebook Page insights and Meta Business Suite
Facebook’s Page Insights article gives these steps: click your profile photo, choose See all profiles, switch into the Page, click Professional dashboard, then Insights (checked November 2026). Facebook says the Professional dashboard now shows up as Creator Dashboard or Business Dashboard, so you may see one of those names instead.
Limits from the same page: Page Insights go back two years, demographics need data from 100 or more people, and Pages categorized as Community Pages have no insights.
If you run a Page and an Instagram professional account together, Insights in Meta Business Suite puts both in one place. Pick the Page or profile from the dropdown in the top left, then click Insights. Its tabs include Overview (focused on the past 28 days), Results, Audience, Content, Ads and Benchmarking, which compares you with businesses in the same category (checked November 2026). If Facebook and Instagram are your only platforms, that may be all the combined view you need.
Threads insights
Threads’ help article, View insights on Threads, gives the computer route: go to threads.com and click Insights in the left menu (checked November 2026). You can also pin insights as a column next to your feeds.
Per post you get views, unique viewers, profile visits, follows, a follower vs. non-follower split, where views came from (Home, profile, Activity, Search) and viewer demographics. The profile view adds net followers and interactions, which Threads counts as likes, replies, reposts and shares. Meta notes that some of these metrics are estimated.
What the native screens can’t do
Retention, traffic sources and demographics are all in the native screens, for free. The gaps show up when the same video goes to five places:
- No single view. To see which platform a video did best on, you copy numbers from five apps into a spreadsheet.
- Different definitions. YouTube counts a view at the start of playback, Instagram separates views from unique viewers, and TikTok’s viewer demographics are estimates. A sum across apps is a rough total.
- Limited history. Instagram’s account view covers 90 days and Facebook’s two years.
- Nothing to hand over. Client reports and competitor benchmarks come from separate tools.
If none of that bothers you, checking each app once a week is a perfectly good routine for a single creator.
Social media analytics tools compared
Everything here comes from each company’s own pages, checked November 2026; follow the links before you pay. For a broader comparison that weighs scheduling first, see the best social media scheduling tools.
| Tool | Analytics focus | Free option | Pricing |
|---|---|---|---|
| Metricool | Reports, competitors, ads next to organic posts | Free plan: 1 brand, 30 days of analytics | metricool.com/pricing |
| Hootsuite | Cross-network reports, competitor and industry benchmarks | 14-day trial | $99 USD per user a month, billed annually (plans) |
| Sprout Social | Cross-network and competitor reports for teams | 30-day trial | sproutsocial.com/pricing |
| Iconosquare | Analytics dashboards, competitor tracking, white-label reports | 2-week trial | iconosquare.com/plans-and-pricing |
| Buffer | Simple per-channel and all-channel insights with scheduling | Free plan with core Insights | buffer.com/pricing |
| Later | Per-platform analytics on paid plans, a combined dashboard on Scale | 14-day trial | later.com/pricing |
| Repostly | Views, likes, comments and followers for TikTok, Instagram, YouTube, Facebook and Threads | 7-day trial | $19 a month for 5 accounts |
Metricool
Metricool’s analytics page covers one dashboard for social accounts, ads and website analytics, with reach, engagement, follower growth and demographics. It adds competitor analysis, campaign dashboards that group organic posts with paid ads, custom branded reports and a feature called Metricool Studio that builds charts from a plain-language request. The pricing page shows a free plan with one brand, 30 days of analytics history and five competitor profiles, but no automated reports or PDF downloads.
Pick it if reports are the job, especially for clients, or you want ads and organic posts in one place.
Hootsuite
Hootsuite Analytics puts Facebook, Instagram, TikTok, X, LinkedIn, Pinterest, YouTube and Threads in one dashboard, with report templates, exports to CSV, XLSX, PDF or PPT, a weekly or monthly performance score, best times to publish per network, and competitor and industry benchmarks. Its plans page lists five competitors on Standard and up to 20 on Professional.
Pick it if a team reports to management and needs benchmarks and exports. It’s a lot to pay for if you only want your own numbers.
Sprout Social
Sprout Social’s analytics covers Instagram, Facebook, X, Bluesky, Threads, TikTok, LinkedIn, YouTube and Pinterest, with profile, post, paid, competitor, tag and team activity reports. Its pricing page sells deeper reporting as a separate Premium Analytics add-on and offers a 30-day trial.
Pick it if you’re a team that wants reports on its own work, such as response times, next to post performance.
Iconosquare
Iconosquare is an analytics-first tool. It covers Instagram, TikTok, Facebook, LinkedIn, X, Threads, Pinterest and YouTube, says it tracks over 100 metrics, suggests posting times, and offers custom dashboards, competitor and hashtag tracking and automated white-label reports. The trial runs two weeks without a card.
Pick it if you want analytics and reports as the main product rather than an extra inside a scheduler.
Buffer
Buffer’s Insights shows likes, comments, impressions, reach and new followers with the change from the previous period, an all-channels report, side-by-side channel comparisons and plain-language weekly takeaways. Each metric shows when it was last updated. The core is included on the free plan; paid plans add longer history and PDF and CSV exports. Buffer also offers an API and an MCP server, so an assistant like Claude can query your numbers.
Pick it if you schedule with Buffer already and want clear, simple numbers without a separate tool.
Later
Later’s analytics gives basic per-platform analytics on paid plans. A combined dashboard, Custom Analytics, covers Instagram, Facebook, TikTok, Pinterest and Threads with filters and up to two years of history, but only on the Scale plan. Later notes that Instagram analytics need a Business or Creator profile and audience data needs at least 100 followers.
Pick it if Instagram leads your marketing and you also want Later’s visual planner and link in bio.
What Repostly’s Insights show
With Repostly, one upload goes to TikTok, Instagram, YouTube, Facebook Pages and Threads, with several accounts per platform. The Insights page then reads back how those posts did, side by side, so you see every platform in one view instead of five apps and a spreadsheet.
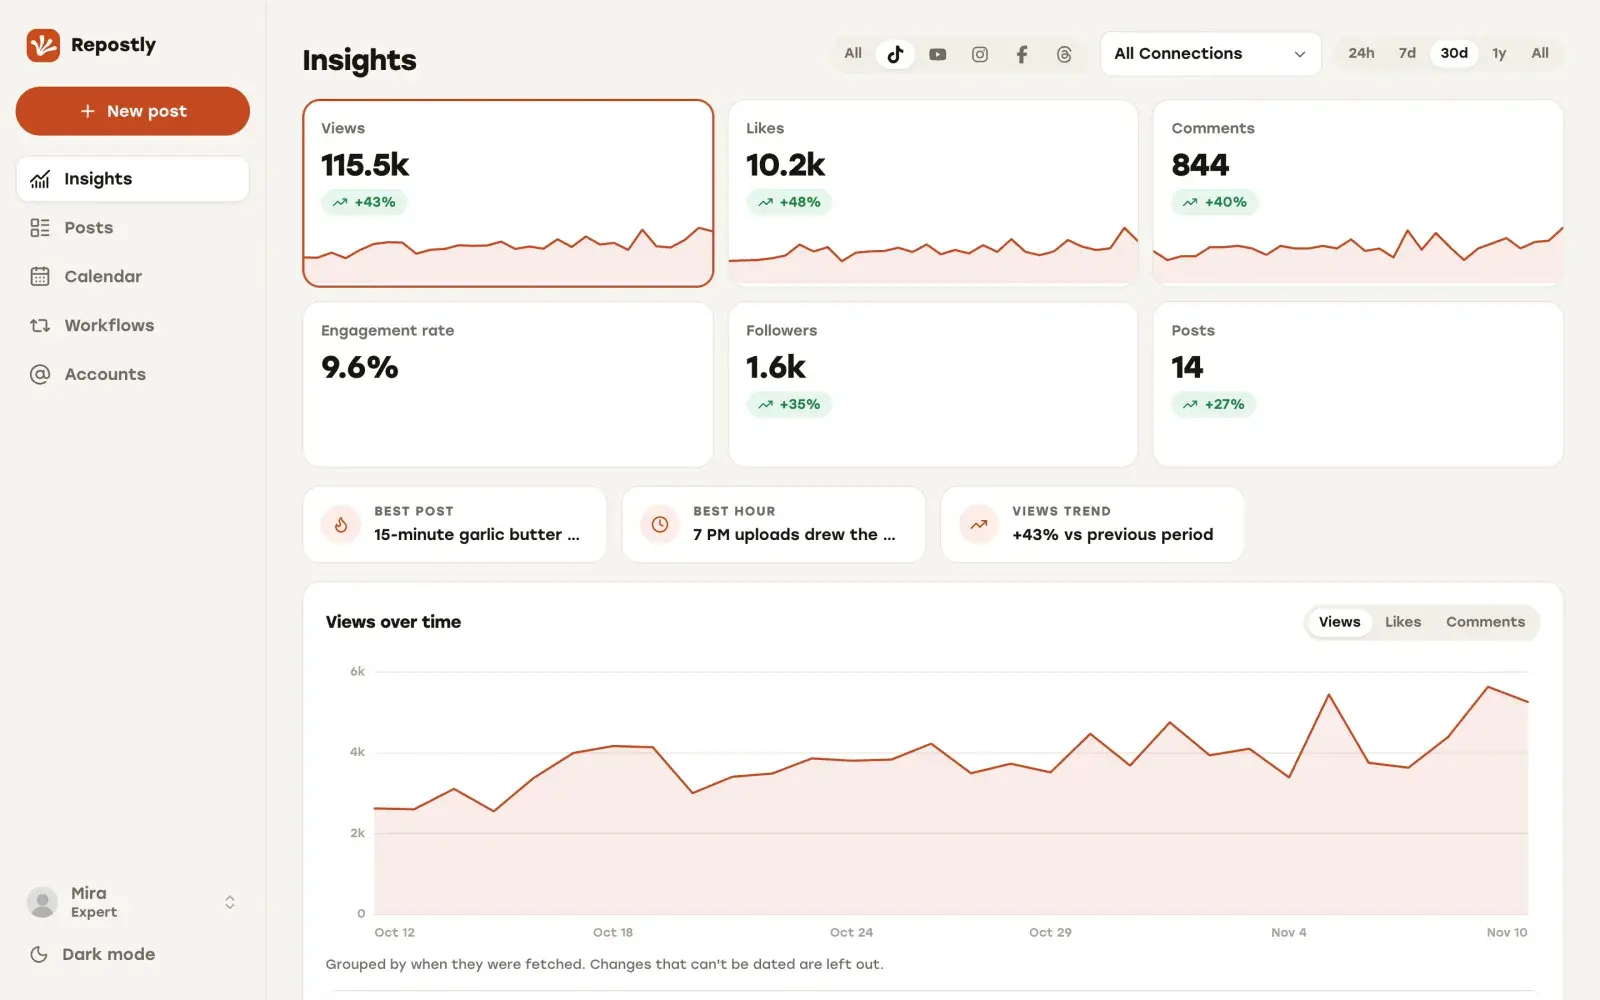
What you get, for all platforms or one, for one account or all of them, over 24 hours, 7 days, 30 days, a year or all time:
- Six tiles: views, likes, comments, engagement rate, followers and posts. All but engagement rate show the change from the previous period of the same length.
- A trend chart for views, likes or comments.
- Views by platform, showing how the total splits across the five apps.
- Top posts, where a video you sent to five platforms counts as one post with a breakdown per platform.
- Best time to post, which charts the hours of the day in which your posts gained views, counted at Repostly’s hourly checks and shown in your time zone.
Each post’s own page has the same idea at a smaller scale. It lists each destination’s status with its own views, likes and comments, and adds tiles for the post’s total views, likes, comments and engagement rate across its destinations, plus a chart of the views it gained over time, which you can filter by platform. The tiles are totals and the chart shows change, so the two won’t match.
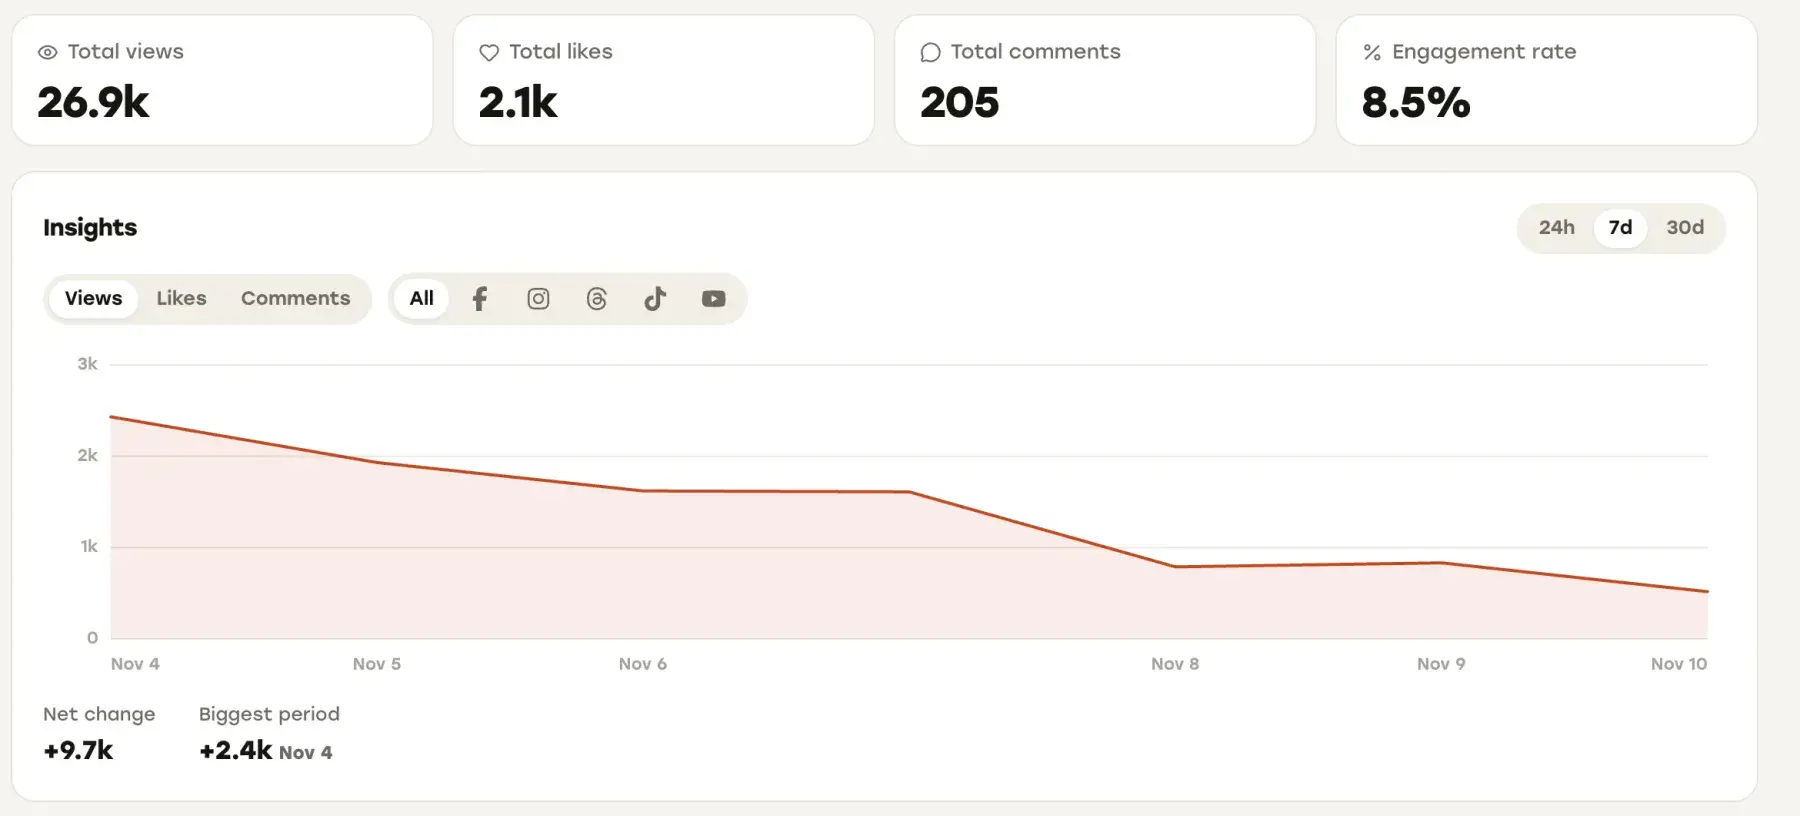
Some details that matter when you compare our numbers with the apps’:
- Which posts count. Repostly also picks up posts you published directly in the apps, not only the ones sent through Repostly. For a video Repostly didn’t publish, a period number counts growth from the first time Repostly read it; earlier views only show up in the All time totals.
- What “views” means. We take each platform’s own count: TikTok’s and YouTube’s view counts, Instagram’s and Threads’ views, and Facebook’s plays for reels or video views for regular videos. Facebook photos report likes and comments but no views. Threads replies are counted as comments.
- Periods show change. For 24 hours to a year, the tiles and charts show views gained in that period, not lifetime totals. Switch to All time for totals.
- Engagement rate is likes plus comments divided by views. Instagram’s “interactions” also include saves and shares, so expect our rate to differ from theirs.
- Freshness. Post stats and follower counts refresh hourly, and new posts on your accounts are picked up every 15 minutes. A YouTube channel that hides its subscriber count shows no follower number here either.
Repostly focuses on the numbers you compare across platforms, so for retention, traffic sources and demographics, keep using the native screens above. Insights are part of every plan, and if you work with scripts or an AI assistant, the REST API and MCP server can read the same analytics.
For timing, the best time to post on social media explains how to read the Best time to post card. Plans start at $19 a month for 5 accounts; see our pricing section.
How to choose
Decide by what you’ll do with the numbers:
- Learning what works on one or two apps: the native analytics are enough.
- One view across several platforms: a scheduler with built-in analytics, such as Repostly, Buffer or Metricool.
- Reports for someone else, or competitor tracking: a reporting-first tool such as Metricool, Hootsuite, Sprout Social or Iconosquare. Of the native screens above, only Meta Business Suite offers benchmarks, by business category.
Whatever you pick, keep checking the native screens now and then. Retention and traffic sources live there, and they’re what tell you why a video worked, which is what changes your next one.
If your videos go out to several platforms and you want to see how each one did without opening five apps, try Repostly free for 7 days. Every plan includes Insights, yearly billing gives two months free, and you can ask for a refund within 14 days of your first payment.
Frequently asked questions
How do I check Instagram analytics?
In the Instagram app, go to your profile, tap a post or reel and tap View Insights to see its views and interactions. For the whole account, open instagram.com on a computer, select Dashboard in the left menu, then Insights under For professionals if you have a professional account, or Your dashboard under Your insights and tools if you have a personal one. Instagram's Help Center says the account has to be public, and you can look at any period within the past 90 days.
What is the best social media analytics tool?
Start with the free analytics inside each app, because they have the most detail: retention, traffic sources and audience demographics. Add a separate tool only when you need one view across platforms, reports for someone else or competitor tracking. Metricool and Hootsuite are strongest on reports and benchmarks, Sprout Social and Iconosquare also focus on reporting, Buffer and Later include analytics with scheduling, and Repostly shows views, likes and comments for TikTok, Instagram, YouTube, Facebook and Threads in one place.
Keep reading

The Best Social Media Scheduling Tools, Compared by Use Case
Buffer, Later, Metricool, Hootsuite, Repurpose.io, Post Bridge and Repostly side by side: platforms, free plans, starting prices and who each one suits.

Social Media Automation Tools: What They Can and Can't Do
What social media automation tools really automate, where platform rules draw the line, and seven tools described from their own pages, with honest picks.

The Best Free Social Media Schedulers and What Their Free Plans Allow
Which schedulers have a real free plan in November 2026, what each one caps, which are only trials, and when native tools or a paid plan make more sense.
Post once. Show up everywhere.
Start your 7-day free trial and publish your next video to every platform in minutes.Pick a plan and publish your next video to every platform in minutes.
Start your free trialSee plansCancel anytime