8 Essential KPIs for Social Media to Track in 2025
Discover the top 8 KPIs for social media to measure success. Learn how to track engagement, conversions, and ROI to optimise your strategy in 2025.

In the fast-paced world of social media, it's easy to get lost in a sea of data. While follower counts and likes might feel rewarding, they often fail to tell the whole story of your impact. To truly understand your performance and drive meaningful business results, you need to focus on the right key performance indicators (KPIs). These metrics move beyond surface-level vanity and provide a clear picture of what's working and what isn't.
This guide cuts through the noise to reveal the 8 most crucial kpis for social media success in 2025. We will explore exactly what each metric means, why it’s vital for your strategy, and how to track it effectively. You'll gain the insights needed to transform your social media presence from a simple broadcast channel into a powerful engine for growth.
By concentrating on these specific indicators, you can make data-driven decisions that genuinely improve your outreach, prove your return on investment, and build a strategy that consistently delivers tangible outcomes. Let's move past the guesswork and start measuring what truly matters for your organisation.
1. Engagement Rate
Engagement rate is one of the most fundamental kpis for social media, measuring the active participation your content generates relative to your audience size. It goes beyond passive views, revealing how compelling and relevant your content truly is to your followers. A high engagement rate signals a healthy, interactive community, while a low rate may indicate your content isn't resonating.
It's typically calculated by dividing the total number of engagements (likes, comments, shares, saves) on a post by your total follower count or the post's reach, then multiplying by 100. Using reach provides a more accurate picture of how engaging a specific piece of content was to those who actually saw it.
Why It's a Key Performance Indicator
This KPI is vital because it directly reflects audience interest and content quality. Algorithms on platforms like Instagram and Facebook prioritise content with high engagement, boosting its visibility in user feeds. Brands like Glossier master this, maintaining a 3-5% engagement rate by consistently featuring user-generated content and actively responding to comments, making their community feel heard and valued.
Benchmarks and Visualisation
Engagement rates vary significantly across platforms due to different user behaviours and algorithms. The bar chart below illustrates the average engagement rate benchmarks for three major platforms, providing a clear visual comparison.
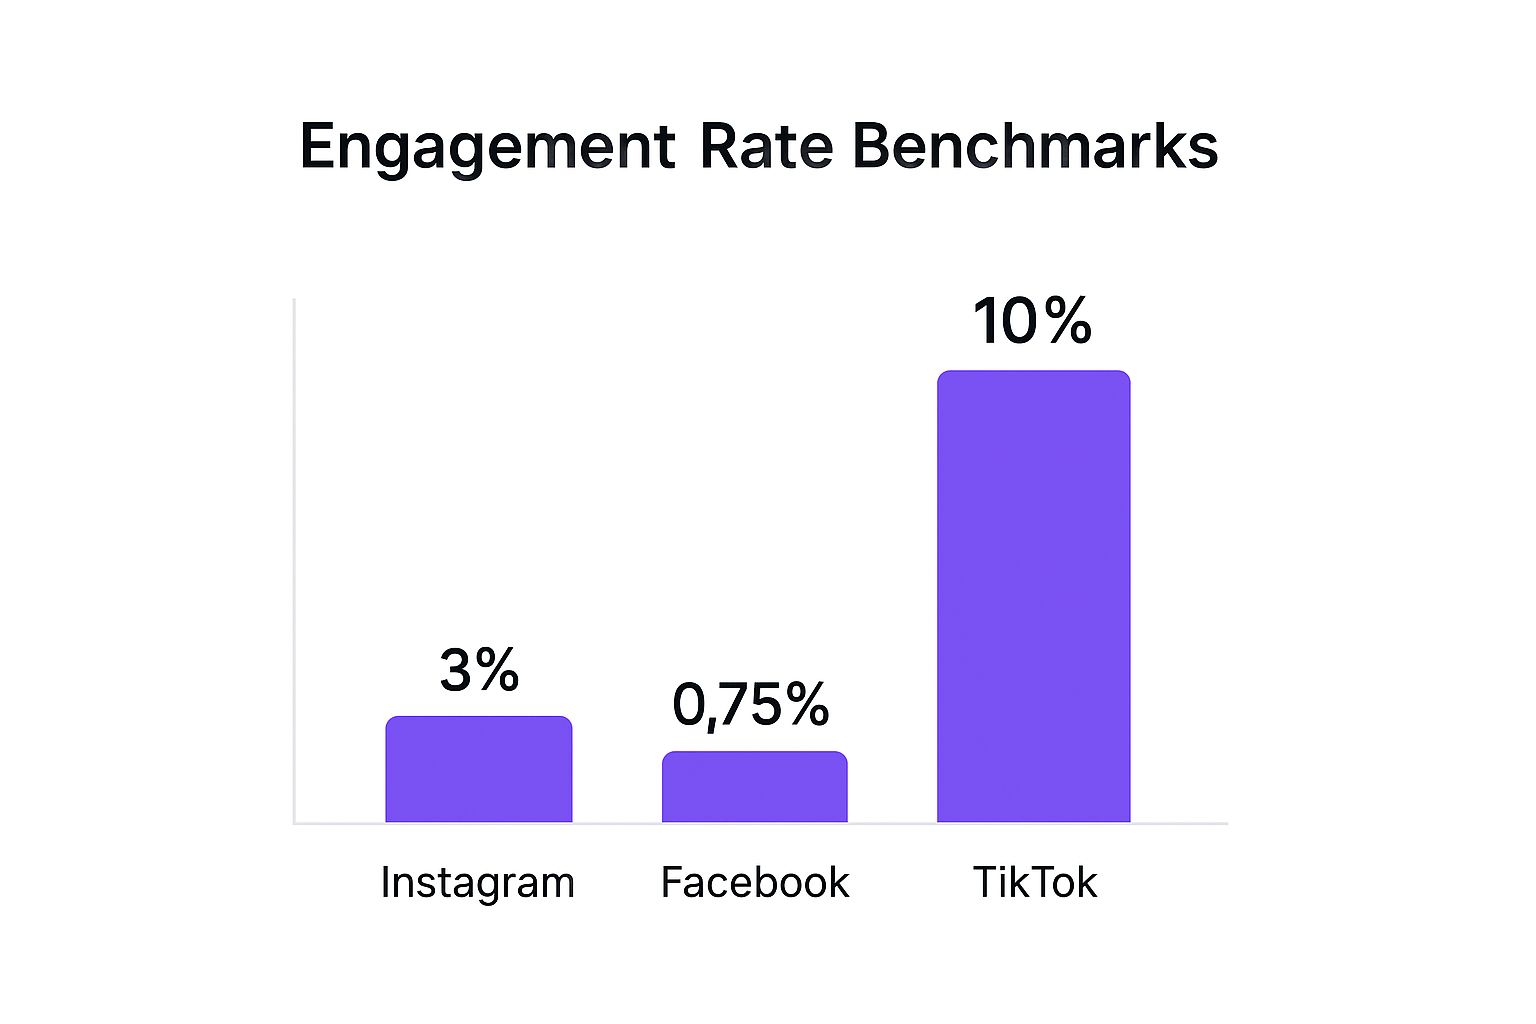
As the chart shows, TikTok's algorithmically-driven, discovery-focused nature leads to exceptionally high average engagement, while Facebook's more mature user base results in lower, yet still valuable, interaction levels. For a deeper dive into professional networks, you can also analyse LinkedIn engagement rates to set platform-specific goals.
How to Improve Your Engagement Rate
Boosting engagement requires a strategic, audience-centric approach. Here are actionable tips to get you started:
- Spark Conversations: Actively ask questions in your captions and use clear calls-to-action (CTAs) like "Tag a friend who needs to see this!" to prompt comments.
- Be Responsive: Aim to reply to comments and messages within the first hour of posting. This quick interaction can increase your content's algorithmic visibility.
- Leverage Interactive Features: Use native tools like polls, quizzes, and "Add Yours" stickers on Instagram Stories to create fun, low-effort ways for your audience to engage.
- Create Shareable Value: Focus on content that is either highly educational (tutorials, tips), entertaining (memes, behind-the-scenes), or emotionally resonant.
2. Reach and Impressions
Reach and impressions are foundational visibility kpis for social media, quantifying how widely your content is being distributed. Reach measures the total number of unique users who saw your content, while impressions count the total number of times your content was displayed, which can include multiple views by the same person.
These two metrics work together to tell a story about your content's visibility. A high reach indicates that your content is successfully breaking out beyond your immediate follower base, while a high impressions-to-reach ratio suggests your content is sticky and compelling enough for users to view it multiple times.
Why It's a Key Performance Indicator
These metrics are vital for understanding your brand awareness and the potential size of your audience. They act as the top of your marketing funnel, indicating how many people your message is getting in front of. A campaign like Dove's "Real Beauty" showcases this power, achieving over 1 billion impressions across social platforms by creating a message that resonated deeply and was shared widely, massively expanding its brand visibility.
Benchmarks and Visualisation
Monitoring reach and impressions over time helps identify which content formats and topics are most effective at capturing attention. A sudden spike in reach might indicate a post is going viral, while consistently low impressions could signal an issue with your posting times or hashtag strategy. Analysing these trends allows you to refine your content plan for maximum visibility.
How to Improve Your Reach and Impressions
Expanding your content's visibility requires a multi-faceted strategy focused on shareability and platform algorithms. Here are several actionable tips to boost these crucial metrics:
- Optimise Posting Times: Analyse your social media analytics to identify when your audience is most active and schedule your posts for these peak periods to maximise initial visibility.
- Use Strategic Hashtags: Research and use a mix of broad, niche, and branded hashtags to expose your content to new users who are searching for or following those topics.
- Encourage Sharing: Create content that provides immense value, humour, or emotional connection, and include clear calls-to-action like "Share this with someone who needs to hear it!"
- Collaborate with Partners: Team up with influencers, complementary brands, or creators to tap into their audiences and extend your reach to new, relevant communities.
3. Click-Through Rate (CTR)
Click-Through Rate (CTR) is one of the most direct kpis for social media for measuring how effectively your content drives action. It calculates the percentage of people who clicked on a specific link within your post out of the total number who saw it. CTR bridges the gap between on-platform engagement and off-platform business goals like website traffic, lead generation, or sales.
Calculated as (Total Clicks ÷ Total Impressions) × 100, this metric reveals how compelling your copy, visuals, and call-to-action (CTA) truly are. A high CTR indicates that your content successfully created enough curiosity or value to make someone leave the social platform and explore your offering further.
Why It's a Key Performance Indicator
CTR is vital because it quantifies your ability to convert social media visibility into tangible traffic. Unlike engagement, which stays within the platform's ecosystem, CTR measures the first step in the customer journey towards conversion. It's a clear indicator of how well your social media efforts support broader marketing objectives. For instance, Shopify excels by showcasing merchant success stories on Instagram, using clear CTAs to drive a consistent CTR of 3-4% to their sign-up pages. Similarly, HubSpot achieves a 2-3% CTR on LinkedIn by offering high-value educational content that prompts clicks.
Benchmarks and Visualisation
CTR benchmarks vary dramatically by platform, industry, and content format. For example, a link in an Instagram Story sticker might naturally perform better than a link in a crowded Facebook feed. It's crucial to analyse your own historical data and industry reports to set realistic goals. Keeping detailed records is essential, and you can delve deeper into compiling these metrics by reading about social media analytics reports to refine your strategy.
How to Improve Your Click-Through Rate
Boosting your CTR involves optimising every element of your post to encourage a click. Here are proven tactics to implement:
- Create Compelling Copy: Use benefit-focused language that sparks curiosity or urgency. Instead of "Read our new blog," try "Find out the 3 mistakes costing you sales."
- Use Clear CTAs: Tell users exactly what to do and what they will get. Phrases like "Download your free guide" or "Shop the collection now" leave no room for ambiguity.
- Optimise Link Placement: On platforms like Instagram, place links in your bio or Stories. For Facebook and LinkedIn, test different formats like link preview cards versus placing the link in the text.
- Use Branded Short URLs: Custom short links (e.g., bit.ly/YourBrand) are not only cleaner but also build trust and brand recognition, making users more likely to click.
- Ensure Landing Page Congruence: The destination page must deliver on the promise made in your social media post. A mismatch will lead to high bounce rates and damage user trust.
4. Conversion Rate
Conversion rate is one of the most critical kpis for social media because it directly links your social activities to tangible business objectives. This metric measures the percentage of users who perform a desired action after clicking a link in your post, such as making a purchase, signing up for a newsletter, or downloading a resource. It is the ultimate test of your social media ROI.
This KPI is calculated by taking the total number of conversions and dividing it by the total number of clicks or visitors from a specific social media campaign, then multiplying the result by 100. It moves beyond vanity metrics like likes and followers to measure real-world impact.
Why It's a Key Performance Indicator
This KPI is essential as it proves the monetary value of your social media strategy. While high engagement is great, a high conversion rate demonstrates that your content is successfully persuading your audience to take the next step in the customer journey. For example, Dollar Shave Club achieved a remarkable 12% conversion rate on Facebook by using targeted ads with clear, compelling value propositions that led directly to sign-ups.
Benchmarks and Visualisation
Conversion rates can fluctuate dramatically based on the industry, offer, and platform. A "good" rate can be anywhere from 2% to over 10%. Gymshark, for instance, consistently drives a 6-8% conversion rate by creating a strong community feel and offering exclusive deals to its social media followers, effectively turning followers into loyal customers.
As the chart indicates, different actions carry different conversion potentials. A simple newsletter sign-up will naturally have a higher conversion rate than a high-ticket purchase, which requires more consideration. To track these actions effectively, you must learn to set up Google Analytics goals, which allows you to attribute website actions back to their social media origins.
How to Improve Your Conversion Rate
Boosting your conversion rate requires a seamless and compelling user journey from social media to your website. Here are some actionable strategies:
- Implement Robust Tracking: Set up tracking tools like the Meta Pixel and use UTM parameters in your links to accurately attribute conversions to specific social campaigns and posts.
- Create Dedicated Landing Pages: Send traffic from your social media ads or posts to a specific landing page that matches the message and offer, ensuring a consistent and relevant user experience.
- Optimise for Mobile: The vast majority of social media traffic comes from mobile devices. Ensure your landing pages and checkout processes are fully optimised for a smooth mobile experience.
- Utilise Retargeting: Run retargeting campaigns to re-engage users who visited your site but did not convert. Reminding them of the product or offer can significantly increase conversions.
5. Follower Growth Rate
Follower growth rate is one of the most dynamic kpis for social media, measuring the speed at which your audience is expanding over a specific period. It moves beyond the vanity metric of raw follower count by calculating the percentage change, offering a standardised way to track momentum. A positive growth rate signals that your content strategy and discoverability efforts are effectively attracting and retaining new audience members.
This KPI is calculated by taking your net new followers (followers gained minus followers lost) in a period, dividing that by your total followers at the start of the period, and multiplying by 100. This percentage-based view allows for meaningful comparisons, whether you have a thousand followers or a million.

Why It's a Key Performance Indicator
This KPI is crucial because it directly reflects your brand's growing relevance and reach in the social space. A stagnant or negative growth rate can be an early warning that your content is failing to attract new eyes or retain existing ones. For instance, Ryanair achieved a staggering 300% growth on X (formerly Twitter) in 2023 by leaning into a controversial, witty, and trend-responsive content strategy that consistently captured new audience attention.
Benchmarks and Visualisation
A "good" follower growth rate is highly dependent on your industry, platform, and business maturity. A new brand might aim for 10-15% monthly growth, similar to what a powerhouse like MrBeast maintains through viral content. In contrast, an established brand like Patagonia sees steady 2-3% monthly growth by focusing on authentic, mission-driven content that resonates deeply with a specific niche. Analysing these benchmarks helps set realistic and ambitious goals for your own account.
How to Improve Your Follower Growth Rate
Accelerating follower growth requires a multi-faceted strategy focused on visibility, value, and conversion. Here are several actionable tips to implement:
- Optimise Your Profile: Treat your bio, profile picture, and pinned posts or highlights as a landing page. Clearly state who you are and what value you provide to convert profile visitors into followers.
- Collaborate Strategically: Partner with influencers or complementary brands for cross-promotional campaigns. This exposes your profile to relevant, engaged audiences who are likely to be interested in your content.
- Boost Discoverability: Consistently use a mix of broad and niche hashtags, as well as location tags where relevant, to appear in more search results and explore pages.
- Run Targeted Campaigns: Use strategic contests or giveaways that require a follow to enter. This can provide a significant, short-term boost to your growth rate. For a deeper dive, explore these effective social media growth strategies.
6. Share of Voice (SOV)
Share of Voice (SOV) is one of the most insightful competitive kpis for social media, quantifying your brand's visibility in online conversations compared to your competitors. It moves beyond your own channel's performance to gauge your overall presence within your industry's digital landscape. A dominant SOV indicates strong brand awareness and relevance in your market.
It's calculated by tracking all mentions of your brand across social media during a specific period, dividing that number by the total mentions of all your defined competitors (plus your own), and then multiplying by 100. This percentage reveals how much of the conversation you truly own.
Why It's a Key Performance Indicator
This KPI is crucial for competitive intelligence. It contextualises your social media efforts, showing whether your brand is a market leader, a close competitor, or an emerging voice. For example, Tesla consistently dominates over 70% of the SOV in the electric vehicle category, not through advertising, but through product innovation and the strong personal brand of its CEO, which fuels constant online discussion. Similarly, Spotify commands a high SOV in music streaming, especially during its annual "Wrapped" campaign.
Benchmarks and Visualisation
SOV is highly industry-specific, with market leaders often commanding the lion's share. In the soft drinks sector, Coca-Cola and Pepsi are in a constant battle, each typically holding around 40-45% of the conversation. In athletic apparel, Nike's strategic athlete partnerships and cultural campaigns help it maintain a commanding 60-70% SOV. Tracking this over time reveals shifts in market dynamics and the impact of specific campaigns.
This visual representation underscores how a brand like Tesla can achieve market dominance in conversation share, offering a clear benchmark for ambitious brands.
How to Improve Your Share of Voice
Increasing your SOV requires a proactive strategy to insert your brand into relevant conversations and generate your own.
- Define Competitors Clearly: Your SOV is only as accurate as your competitor list. Include both direct and indirect rivals for a comprehensive picture.
- Utilise Social Listening Tools: Platforms like Brandwatch or Sprout Social are essential for accurately tracking your brand mentions versus competitor mentions across social media.
- Analyse Sentiment: Don't just track mention volume. Analyse the sentiment (positive, negative, neutral) to understand the quality of the conversation surrounding your brand.
- Target Niche Topics: Identify specific sub-topics or keywords within your industry where competitors are weak. Create targeted content to own these niche conversations and build your overall SOV.
7. Response Rate and Response Time
Response rate and time are crucial customer service kpis for social media, measuring how often and how quickly you reply to your audience. Response rate is the percentage of inbound messages and mentions you reply to, while response time measures the average time it takes your team to do so. In an era where social media is a primary customer support channel, these metrics directly reflect your brand's commitment to its community.
A high response rate and low response time signal to customers that your brand is attentive, reliable, and values their input. Failing to monitor these KPIs can lead to customer frustration, negative public sentiment, and a perception that your brand is unorganised or uncaring.
Why It's a Key Performance Indicator
This KPI is vital because it directly impacts customer satisfaction, loyalty, and brand reputation. Fast, helpful responses can turn a negative customer experience into a positive one and build strong, lasting relationships. A brand that is consistently responsive is seen as more trustworthy and customer-centric, which can significantly influence purchasing decisions.
A prime example is JetBlue, which revolutionised airline customer service on Twitter by responding to over 90% of mentions, often within 30 minutes. This proactive approach not only resolves issues efficiently but also builds immense brand loyalty and sets a high industry standard.
How to Improve Your Response Rate and Time
Improving your responsiveness requires a combination of clear processes, the right tools, and a customer-first mindset. Here are actionable tips to enhance your performance:
- Set Internal Service Level Agreements (SLAs): Establish clear targets for your team, such as responding to all queries within one hour during business hours. This creates accountability and sets customer expectations.
- Use a Unified Inbox: Employ social media management tools that consolidate all messages, comments, and mentions from different platforms into a single stream, preventing anything from being missed.
- Create Response Templates: Develop pre-approved templates for frequently asked questions to speed up response times. Crucially, empower your team to personalise each message to avoid sounding robotic.
- Prioritise Urgently: Triage incoming messages to address critical issues, complaints, and direct questions first before engaging with general comments or praise.
- Acknowledge Publicly, Resolve Privately: Always acknowledge a complaint or issue publicly first to show other users you are attentive. Then, move the detailed conversation to a private channel like DMs to resolve it.
8. Return on Investment (ROI) and Cost Per Result
Ultimately, social media must prove its business value, and these are the kpis for social media that do exactly that. Return on Investment (ROI) measures the total revenue generated from your social media activities compared to the total costs invested. It answers the crucial question: are we making more money than we are spending?
Cost Per Result is a more granular metric, tracking the expense required to achieve a specific outcome, such as a lead, conversion, or even a high-value engagement. Together, these financial metrics transform social media from a perceived cost centre into a measurable, accountable business function. They are calculated as ROI = ((Revenue - Cost) ÷ Cost) × 100, and Cost Per Result = Total Spend ÷ Total Results.
Why It's a Key Performance Indicator
This KPI is vital for justifying budgets, optimising spending, and proving the direct business impact of your social strategy. It connects likes and shares to the bottom line. For instance, ASOS reportedly achieves a 3-4x ROI on its influencer campaigns compared to traditional advertising, demonstrating where its marketing budget is most effective. This level of financial clarity is essential for strategic decision-making.
Benchmarks and Visualisation
ROI and Cost Per Result are highly specific to your industry, business model, and campaign goals, making universal benchmarks less relevant. The goal is internal: to continuously improve your own metrics over time. Visualising this involves tracking trends in your ROI and Cost Per Lead (CPL) month-over-month or campaign-over-campaign to identify what strategies are becoming more efficient.
To truly understand the impact of your efforts, learn how to measure social media ROI effectively and connect your social media activities to tangible business outcomes. A deep dive can help you establish your own internal benchmarks for success.
How to Improve Your ROI and Cost Per Result
Improving your financial return requires a meticulous approach to both spending and strategy. Here are actionable tips to enhance your efficiency:
- Assign Monetary Values: Attach a clear monetary value not just to direct sales but also to non-revenue goals like email sign-ups or downloads, based on their historical value to your business.
- Track Full Costs: Calculate your total investment accurately by including ad spend, tool subscriptions, content creation time, and team salaries.
- Use Multi-Touch Attribution: Implement attribution models that credit social media appropriately for its role in the customer journey, even if it wasn't the final click.
- Optimise at the Campaign Level: Track ROI and Cost Per Result for individual campaigns. This allows you to identify high-performing tactics and reallocate your budget to what works best. For a deeper guide, you can learn more about calculating social media ROI.
8 Key Social Media KPI Comparison
| Metric | Implementation Complexity 🔄 | Resource Requirements ⚡ | Expected Outcomes 📊 | Ideal Use Cases 💡 | Key Advantages ⭐ |
|---|---|---|---|---|---|
| Engagement Rate | Moderate - requires tracking interactions and audience size | Low to Moderate - analytics tools, platform data | Measures audience interaction quality and content resonance | Content performance monitoring, optimizing engagement | Indicates content relevance, boosts organic reach |
| Reach and Impressions | Low - basic platform metrics tracking | Low - native social media analytics | Measures content visibility and potential audience size | Brand awareness campaigns, top-of-funnel evaluation | Essential for visibility, distinguishes new vs. recurring viewers |
| Click-Through Rate (CTR) | Moderate - needs click and impression data integration | Moderate - tracking links, platform analytics | Measures effectiveness of calls-to-action driving traffic | Performance of ads, link posts, and traffic-driving content | Directly measures content's ability to drive action |
| Conversion Rate | High - requires advanced tracking setup and integration | High - pixels, UTM parameters, analytics & CRM systems | Measures percentage completing desired actions | Measuring ROI, campaign success, and business impact | Directly ties social media to revenue and ROI |
| Follower Growth Rate | Low to Moderate - basic follower count tracking | Low - native social media analytics | Measures audience growth momentum | Audience development, brand awareness tracking | Allows meaningful growth comparison across account sizes |
| Share of Voice (SOV) | High - requires social listening and competitive analysis | High - social listening tools and ongoing monitoring | Measures brand visibility relative to competitors | Competitive benchmarking, reputation management | Provides competitive insights and market position |
| Response Rate and Time | Moderate to High - monitoring incoming messages and timely replies | Moderate to High - requires dedicated team and tools | Measures customer service responsiveness | Customer support, brand reputation, engagement enhancement | Improves satisfaction and loyalty, reduces negative feedback |
| ROI and Cost Per Result | High - complex data tracking from spend to revenue | High - comprehensive analytics, multi-channel attribution | Measures financial return and cost efficiency | Budget justification, campaign optimization | Quantifies business value and optimizes marketing spend |
Turn Your Data Into Action: Start Tracking Today
Navigating the dynamic landscape of social media without clear direction is like sailing without a compass. The metrics we have explored, from Engagement Rate to Return on Investment, are not just numbers on a dashboard; they are the essential navigational tools for your digital strategy. They transform abstract goals into tangible, measurable targets and shift your approach from guesswork to a data-informed science. By consistently tracking these kpis for social media, you can finally demystify what works for your brand and what doesn't.
Understanding your Reach and Impressions tells you how far your message is travelling, while monitoring your Click-Through Rate and Conversion Rate reveals how effectively that message inspires action. These metrics work in tandem, providing a holistic view of your marketing funnel, from initial awareness to final purchase. Similarly, tracking your Follower Growth Rate alongside your Engagement Rate ensures you are building a genuinely interested community, not just an empty audience. The true power lies in connecting these dots to see the bigger picture of your performance.
From Measurement to Mastery
The goal is not simply to collect data but to synthesise it into actionable intelligence. Here’s how you can move forward:
- Establish Your Baseline: Before you can measure improvement, you need to know where you stand today. Spend the next 30 days gathering data on the eight KPIs discussed to create a performance baseline for your organisation.
- Set Realistic Goals: Use your baseline data and industry benchmarks to set specific, measurable, achievable, relevant, and time-bound (SMART) goals. For example, aim to increase your Engagement Rate by 0.5% over the next quarter or improve your Response Time by 15%.
- Integrate and Automate: Manually pulling data from multiple platforms is inefficient and prone to error. Adopting a unified analytics tool is no longer a luxury but a necessity for any serious digital marketer. Centralising your data frees up valuable time for what truly matters: analysis and strategic planning.
By embracing this structured approach, you stop reacting to social media trends and start proactively shaping your brand’s digital narrative. These kpis for social media are your feedback loop, constantly informing you on how to refine your content, optimise your ad spend, and deepen your connection with your audience. Mastering them is the key to proving the tangible business value of your social media efforts and securing the resources needed to scale your success.
Ready to stop juggling spreadsheets and start making data-driven decisions with confidence? Repostly centralises all your social media analytics into one intuitive dashboard, making it effortless to track the KPIs that matter most. Gain clarity on your performance across all platforms and reclaim your time by signing up for Repostly today.
Keep reading

10 Fresh Instagram Story Idea Tactics for 2025
Stuck for content? Discover our top Instagram story idea list, with actionable tips to boost engagement and grow your audience in 2025.

A Practical Social Media Planner for German Markets
Build a results-driven social media planner for Germany. This guide offers actionable strategies for content, scheduling, and analysis in the German market.

Crafting Your Social Media Content Plan
Stop guessing and start strategizing. This guide provides an actionable social media content plan to audit, plan, and execute content that gets results.
Post once. Show up everywhere.
Start your 7-day free trial and publish your next video to every platform in minutes.Pick a plan and publish your next video to every platform in minutes.
Start your free trialSee plansCancel anytime